
Fig. 2
- ID
- ZDB-FIG-101111-31
- Publication
- Wise et al., 2010 - bmp2b and bmp4 are dispensable for zebrafish tooth development
- Other Figures
- All Figure Page
- Back to All Figure Page
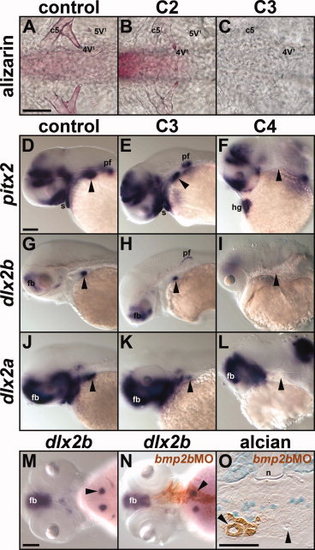
Effects of a bmp2b MO on tooth development. A-C: 108-hpf alizarin-stained larvae (orientation as in Fig. 1) injected with standard control or bmp2b MO and classified into phenotypic severity classes C2 or C3. Left side teeth are designated as in Figure 1. D-L: Expression of markers of tooth germs (pitx2, 48 hpf; dlx2b, 60 hpf) or neural crest cells (dlx2a, 48 hpf) in control MO-injected (D, G, J) and bmp2b-MO injected embryos of phenotypic class C3 (E, H, K) and C4 (F, I, L). Lateral views with anterior to the left. Arrowheads indicate tooth germs (D, E, G, H, J, K) or the location of posterior arch neural crest cells (F, I, L). M:dlx2b expression in tooth germs (arrowhead) of wild type 56-hpf larva (dorsal view, anterior to left). N:dlx2b expression (arrowhead) in transplanted cells (stained brown) targeted to the endoderm and containing a bmp2b MO. O: Transverse section showing transplanted bmp2b MO-containing endodermal cell contribution (stained brown) to the endoderm of a pharyngeal tooth (left arrowhead) in an 84-hpf embryo. Right arrowhead indicates mineralized tooth developed from host cells. Scale bar in A = 50 μm for A–C, in D = 100 μm for D-L; in M = 100 μm for M,N; in O = 50 μm. c5, fifth ceratobranchial; fb, forebrain; hg, hatching gland; n, notochord; pf, pectoral fin; s, stomodeum. |