
Fig. 6
- ID
- ZDB-FIG-100830-6
- Publication
- Chao et al., 2010 - A male with unilateral microphthalmia reveals a role for TMX3 in eye development
- Other Figures
- All Figure Page
- Back to All Figure Page
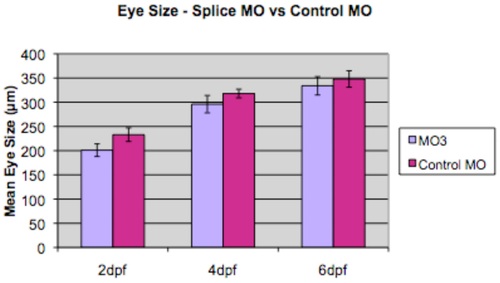
A comparison of eye size in splice morpholino-injected larvae and control-injected larvae. Graph shows mean eye size (measured in µm on y-axis) for splice morpholino-injected larvae (MO3; light purple) compared to control-injected larvae (Control MO; dark purple) at three different time periods, 2 dpf, 4 dpf and 6 dpf, labeled on the x-axis. Data are shown as mean +/- one standard deviation. A representative single experiment is shown, measuring a minimum of 10-20 independent retinas per data point. Analysis using a Two-sample t-test assuming equal variance showed a significant difference at 2 dpf and 4 dpf (p<0.05 for 2 dpf), but not at 6 dpf (p>0.05). |
| Fish: | |
|---|---|
| Knockdown Reagent: | |
| Observed In: | |
| Stage Range: | Long-pec to Day 4 |