
|
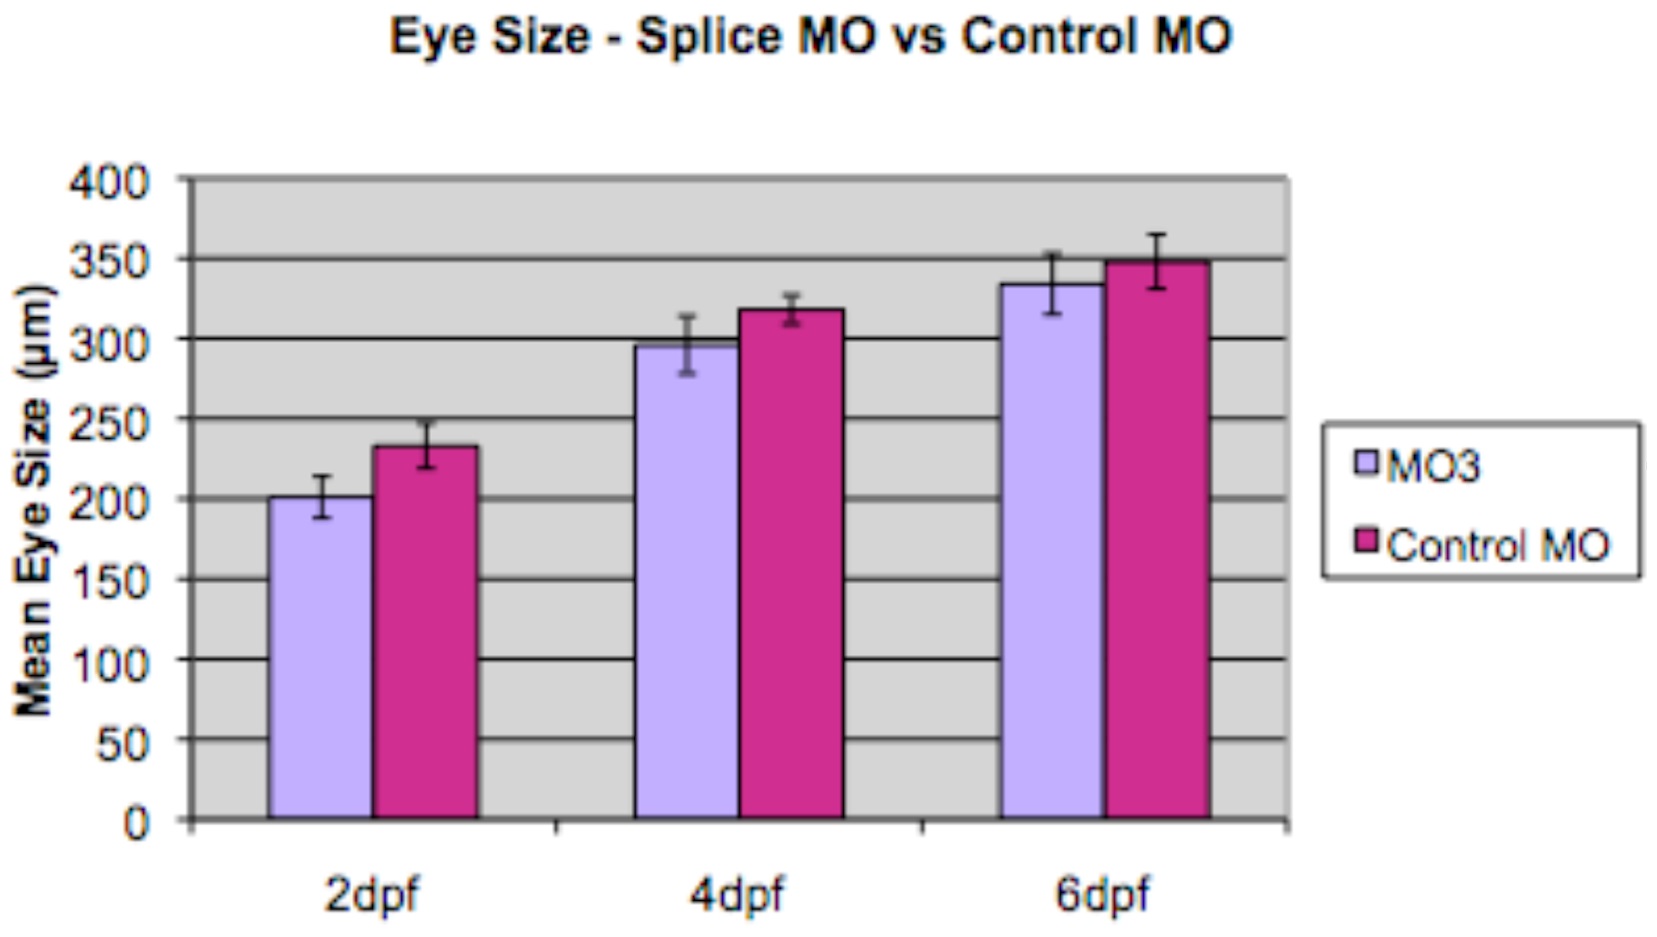
Fig. 6
A comparison of eye size in splice morpholino-injected larvae and control-injected larvae.
Graph shows mean eye size (measured in µm on y-axis) for splice morpholino-injected larvae (MO3; light purple) compared to control-injected larvae (Control MO; dark purple) at three different time periods, 2 dpf, 4 dpf and 6 dpf, labeled on the x-axis. Data are shown as mean +/- one standard deviation. A representative single experiment is shown, measuring a minimum of 10-20 independent retinas per data point. Analysis using a Two-sample t-test assuming equal variance showed a significant difference at 2 dpf and 4 dpf (p<0.05 for 2 dpf), but not at 6 dpf (p>0.05).