
FIGURE
Fig. 7
Fig. 7
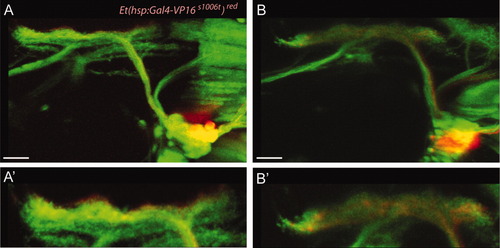
Analysis of lateralis somata ganglionar location and their central projections. A,B: Merge of green- and red-Kaede fluorescent signals. Photoconversion from green- to red-Kaede was performed in dorsally (A) or ventrally (B) located somata in 4-day-old fish from the Et(hsp:Gal4-VP16s1006t);UAS:Kaede double-transgenic line. A′: Detail of the central projections in A. B′: Detail of the central projections in B. All images are maximal projections and lateral views. Dorsal is towards top, anterior is towards left. Scale bar =30 μm. |
Expression Data
| Gene: | |
|---|---|
| Fish: | |
| Anatomical Terms: | |
| Stage: | Day 4 |
Expression Detail
Antibody Labeling
Phenotype Data
Phenotype Detail
Acknowledgments
This image is the copyrighted work of the attributed author or publisher, and
ZFIN has permission only to display this image to its users.
Additional permissions should be obtained from the applicable author or publisher of the image.
Full text @ Dev. Dyn.