
FIGURE
Fig. 1
- ID
- ZDB-FIG-100616-124
- Publication
- Lindeman et al., 2010 - Chromatin states of developmentally-regulated genes revealed by DNA and histone methylation patterns in zebrafish embryos
- Other Figures
- All Figure Page
- Back to All Figure Page
Fig. 1
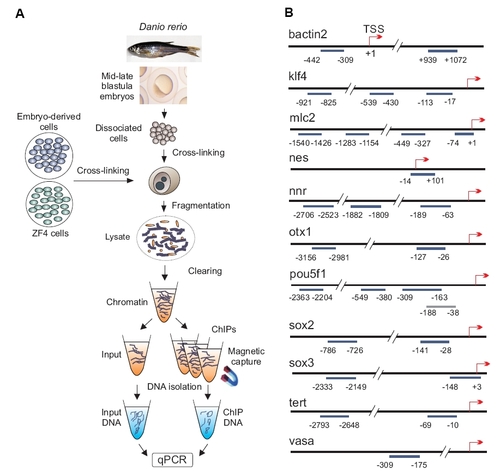
Chromatin immunoprecipitation (ChIP) assay and map of genomic regions examined in this study. (A) Post-translational histone modifications in MBT+ stage embryos, ZF4 cells and MBT+ embryo-derived cultured cells were examined by ChIP-qPCR. (B) Genomic regions examined by ChIP on indicated genes. Numbers indicate the position of amplicons relative to the TSS (+1). |
Expression Data
Expression Detail
Antibody Labeling
Phenotype Data
Phenotype Detail
Acknowledgments
This image is the copyrighted work of the attributed author or publisher, and
ZFIN has permission only to display this image to its users.
Additional permissions should be obtained from the applicable author or publisher of the image.
Full text @ Int. J. Dev. Biol.