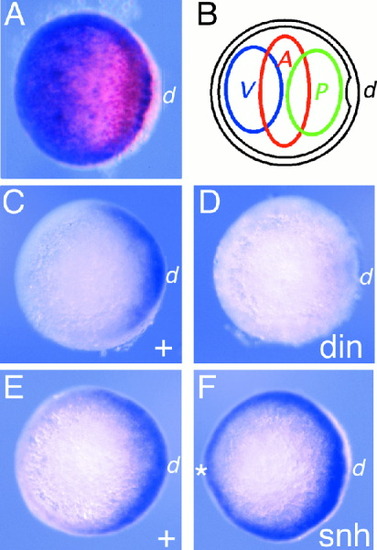
Early pattern in the ectoderm, marked by zic3 expression, is regulated by bone morphogenetic protein (BMP) signaling. Embryos stained by whole-mount in situ hybridization (ISH) for expression of zic3 (orange in A, purple in C-F) and bmp2b/swr (purple in A). All embryos are shown in animal pole view, dorsal to the right. A: zic3 (orange) and bmp2b/swr (purple) are expressed in complementary domains in wild-type embryos. B: Diagram of a specification map, derived from in vitro explant culture assays, of the early gastrula ectoderm (Grinblat et al., [1998]). V, ventral non-neural ectoderm; A, anterior forebrain; P, posterior forebrain. C: Embryo derived from a din/+x din/+ cross, showing a wild-type pattern of zic3 expression. D: Sibling embryo from the same cross, showing a strong reduction in dorsal zic3 expression. Dorsal marginal staining remained unaffected (not shown). E: Embryo derived from a snh/+ x snh/+ cross, showing a wild-type pattern of zic3 expression. F: Sibling embryo from the same cross, showing up-regulation of zic3 expression in ventral posterior ectoderm (white asterisk). Note that the animal pole is still devoid of zic3 expression. d, dorsal; white asterisk marks ventral side.
|

