
Fig. 6
- ID
- ZDB-FIG-100322-1
- Publication
- Zhao et al., 2010 - MicroRNA-Mediated Control of Oligodendrocyte Differentiation
- Other Figures
- All Figure Page
- Back to All Figure Page
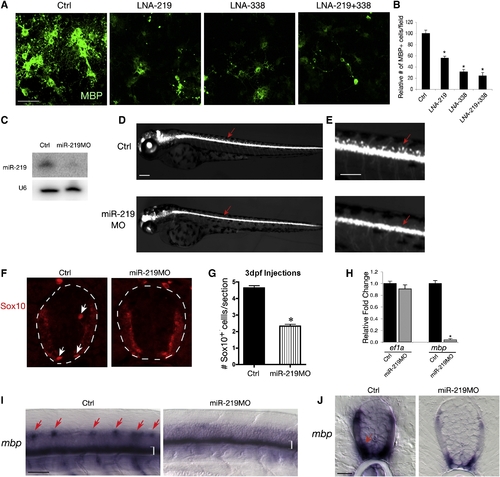
Inhibition of miR-219 and miR-338 Blocks Oligodendrocyte Maturation (A) Purified rat oligodendrocyte precursor cells were transfected with LNA knockdown antisense miRNAs and scrambled control oligonucleotides as indicated and cultured in oligodendrocyte differentiation medium. Four days after transfection, cultures were subjected to MBP immunostaining. (B) Histogram depicts the relative number of MBP+ cells per defined area (0.14 mm2) treated with LNA-anti-219 and LNA-anti-338(5p+3p) compared with that treated with scrambled control oligonucleotide. (C) Expression of miR-219 in WT and miR-219MO-injected larvae was analyzed by northern blot. U6 RNA is used as loading control. (D and E) Stereomicroscope images showing a lateral view of living Tg(olig2:egfp) zebrafish larvae at 3 dpf with or without morpholino miR-219 injection. (E) is shown at larger magnification to show the OPCs in the dorsal spinal cord in control larvae but their absence in the miR-219MO-injected larvae, as indicated by arrows. (F) Transverse sections through the spinal cord of larvae at 3 dpf were immunostained with antibody to Sox10. Sox10+ OPCs are indicated by arrows. (G) Quantification of the average number of Sox10+ OPCs per transverse section in miR-219MO-injected and control zebrafish (n = 46). (H) qRT-PCR analysis of expression of mbp and ef1a encoding eukaryotic elongation factor 1 from RNAs isolated from miR-219MO-injected and control zebrafish (n = 3). rpl13 encoding a ribosomal protein was used as an internal control. (I and J) In situ hybridization with an mbp probe in zebrafish embryos with or without miR-219MO injection. Arrows in (I) (lateral view) indicate the formation of mature oligodendrocytes in the dorsal spinal cord. Brackets indicate mbp expression in ventral spinal cord. Arrows in (J) (cross-section) indicate mbp expression. Data represent mean ± SEM from three independent experiments. *p<0.01 (one-way ANOVA in B; Student′s t test in G and H). Scale bars in (A), 50 μm; (C and D) 40 μm; (E), 20 μm, (G), 40 μm. |
| Genes: | |
|---|---|
| Fish: | |
| Knockdown Reagent: | |
| Anatomical Terms: | |
| Stage: | Protruding-mouth |
| Fish: | |
|---|---|
| Knockdown Reagent: | |
| Observed In: | |
| Stage: | Protruding-mouth |