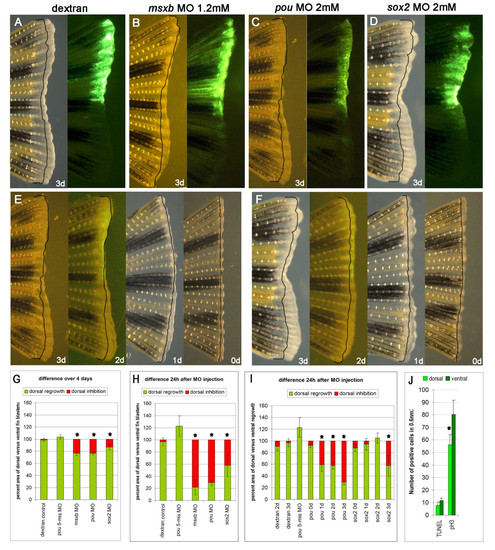
Morpholino injection into zebrafish caudal fins. A-D) Bright field and fluorescence picture of a dextran (A) msxb MO (B) pou MO (C) and sox2 MO (D) injected and electroporated fin: injections were done into the dorsal half of a 3 dpa blastema and photographed 24 h later. E, F) Time course for pou MO (E) and sox2 MO (F) injected and electroporated fins at 3 dpa, 2 dpa, 1 dpa and 0 dpa. Pictures were taken 24 h after injection. G-I) Percentage of dorsal versus ventral fin outgrowth (in green) and average inhibition of dorsal versus ventral fin (in red) of fins which were injected 3 dpa (G, H) and on day 0 to 3 pa as indicated (I). (see Method for exact calculation) (Asterisk indicate significant difference (P < 0.5) compared to dextran or pou 5-mis MO control or for 1 dpa injected fins between pou MO and sox2 MO injected fins). J) Measurement of apoptosis and cell proliferation in pou MO injected fins. There is no significant difference between dorsal and ventral fins in apoptosis as measured by TUNEL while there is a significant reduction of cell divisions in the dorsal fin as measured by pH3 staining (P d 0.05). Black lines indicate blastema size on day of injection. Error bars indicate standard error.
|
