
Fig. 6
- ID
- ZDB-FIG-091217-127
- Publication
- Edeling et al., 2009 - Structural requirements for PACSIN/Syndapin operation during zebrafish embryonic notochord development
- Other Figures
- All Figure Page
- Back to All Figure Page
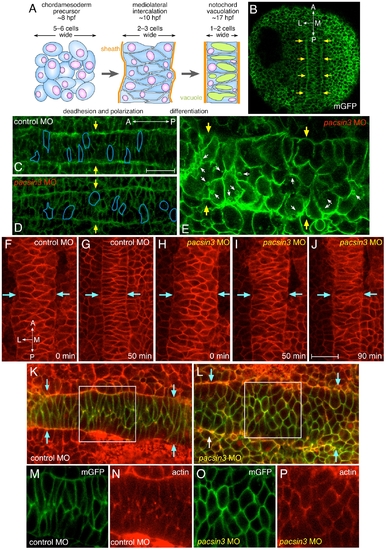
Early midline defects in pacsin3 morphants. (A) Schematic illustration of the mediolateral intercalation process in the forming notochord. (B–C) Representative confocal optical sections of fixed, mGFP and control MO-injected embryos at the 3-somite stage focused on the mesodermal cell layer. The lateral notochord border is indicated (arrows), as are the anterioposterior and mediolateral axes. Bar = 50 μm. (D–E) Representative confocal optical sections of fixed, mGFP and 5 ng pacsin3 MO-injected embryos at the 3-somite stage with moderate (D) or severe (E) phenotypes. The shape of several cells is traced (blue lines), and internal membrane vesicles (small arrows) are shown. (F–J) Selected dorsal midline views from time-lapse recording at the beginning of segmentation (∼10 hpf) of control (7.5 ng; F, G and Video S1) or pacsin3 (7.5 ng; H–J and Video S2 and S3) MO-injected embryos also expressing membrane mcRFP. The lateral notochord border is indicated (arrows). Bar = 50 μm. (K–P) Representative confocal optical sections of fixed, mGFP and control or pacsin3 MO-injected embryos at the 3-somite stage stained with fluorescent phalloidin to reveal actin. Anterior is left. The lateral notochord border is indicated (K and L, arrows), and the separated mGFP (green) and actin (phalloidin, red) channels of the regions boxed in K and L are shown (panels M and O and N and P, respectively). |
| Fish: | |
|---|---|
| Knockdown Reagent: | |
| Observed In: | |
| Stage: | Bud |