
Fig. 4
- ID
- ZDB-FIG-091016-3
- Publication
- Wang et al., 2009 - Zebrafish beta-adrenergic receptor mRNA expression and control of pigmentation
- Other Figures
- All Figure Page
- Back to All Figure Page
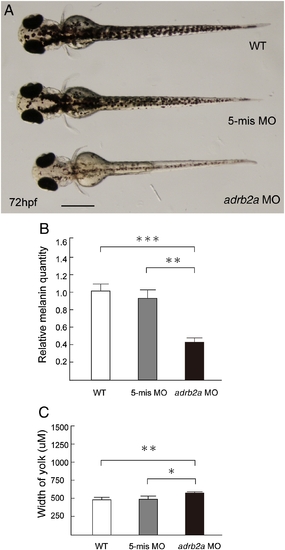
Zebrafish adrb2a loss of function experiments. adrb2a MOs were injected into 1–4-cell stage embryos. (A) Representative images of the dorsal view of wild-type (upper), 5-base mismatch control MO (middle) and adrb2a MO-injected larvae (lower) at 72 hpf. Scale bar indicates 500 μm. (B) Effect of adrb2a MOs on melanin. Five larvae were collected at 72 hpf and dissolved in lysis buffer. After centrifugation, melanin pigment was redissolved in 1 N NaOH, and then total melanin content was quantified by spectrophotometry. Data are presented relative to the wild-type value and are the mean values ± SEM of 12 independent experiments. (C) Width of yolk was measured using NIS Elements D2.20 image analysis software (Nikon). Data are presented as the means ± SEM of 20 larvae at 96 hpf. ∗P < 0.05; ∗∗P < 0.01; ∗∗∗P < 0.001. |
| Fish: | |
|---|---|
| Knockdown Reagent: | |
| Observed In: | |
| Stage: | Protruding-mouth |
Reprinted from Gene, 446(1), Wang, Z., Nishimura, Y., Shimada, Y., Umemoto, N., Hirano, M., Zang, L., Oka, T., Sakamoto, C., Kuroyanagi, J., and Tanaka, T., Zebrafish beta-adrenergic receptor mRNA expression and control of pigmentation, 18-27, Copyright (2009) with permission from Elsevier. Full text @ Gene