
Fig. 4
- ID
- ZDB-FIG-090826-15
- Publication
- Fu et al., 2009 - The Molecular Structures and Expression Patterns of Zebrafish Troponin I Genes
- Other Figures
- All Figure Page
- Back to All Figure Page
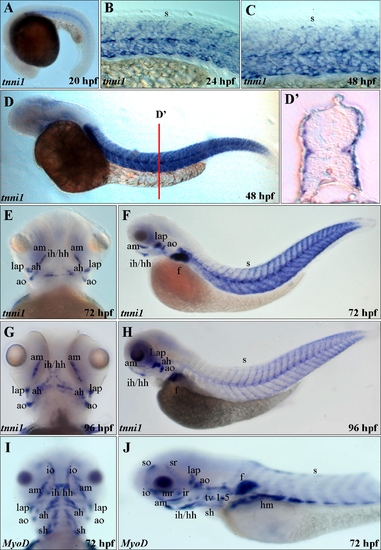
The expression pattern of tnni1 transcript during the development of zebrafish embryos. Embryos at different stages as indicated were collected and hybridized with tnni1 using whole-mount in situ hybridization. Panels A, B, C, D, F and H were lateral views and anterior of embryo to the left; panel E and G were dorsal view and anterior of embryo to the top. tnni1 was expressed in the somite at 20–48 hpf, but it was expressed in craniofacial muscle and fin at 72–96 hpf. Panel D and D′ were whole-mount in situ hybridization and transverse section (red line) at 48 hpf Embryos. Panel D′ was indicated that tnni1 gene was slow-muscle-specific. Panels I and J were hybridized with MyoD, specific marker for craniofacial muscles and truck muscle at 72 hpf Embryos. am, adductor mandibulae; lap, levator arcus palatini; ao, adductor operculi; ah, adductor hyoideus; ih, interhyoideus; hh, hyohyoideus; s, somite; f, fin bud; tv 1–5, transversus ventralis 1–5. |
| Gene: | |
|---|---|
| Fish: | |
| Anatomical Terms: | |
| Stage Range: | 20-25 somites to Day 4 |
Reprinted from Gene expression patterns : GEP, 9(5), Fu, C.Y., Lee, H.C., and Tsai, H.J., The Molecular Structures and Expression Patterns of Zebrafish Troponin I Genes, 348-356, Copyright (2009) with permission from Elsevier. Full text @ Gene Expr. Patterns