
FIGURE
Fig. S2
- ID
- ZDB-FIG-090804-9
- Publication
- Kurrasch et al., 2009 - Neuroendocrine transcriptional programs adapt dynamically to the supply and demand for neuropeptides as revealed in NSF mutant zebrafish
- Other Figures
- All Figure Page
- Back to All Figure Page
Fig. S2
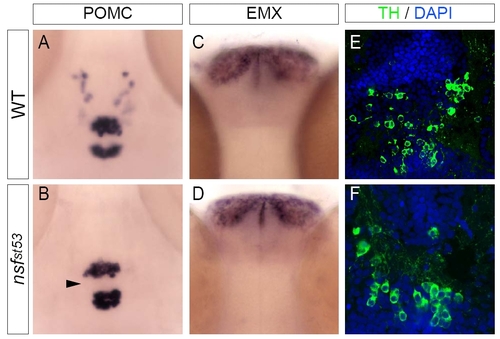
Transcript and protein levels are equal in other brain regions (A-D) and in hypothalamic catecholamine neurons (E-F) in WT and nsf mutant 5dpf larvae. (A-D) Whole-mount expression patterns are shown for pomc (A-B) and emx (C-D) in WT and nsfst53 zebrafish (n≥8 per marker per genotype). Maintained expression of pomc in nsf mutant pituitary is noted (black arrowhead). (E-F) Tyrosine hydroxylase protein levels in hypothalamic neurons is shown in sectioned WT and nsfst53 zebrafish (n=7 ea). Cell bodies are shown with DAPI stain. |
Expression Data
Expression Detail
Antibody Labeling
Phenotype Data
Phenotype Detail
Acknowledgments
This image is the copyrighted work of the attributed author or publisher, and
ZFIN has permission only to display this image to its users.
Additional permissions should be obtained from the applicable author or publisher of the image.
Full text @ Neural Dev.