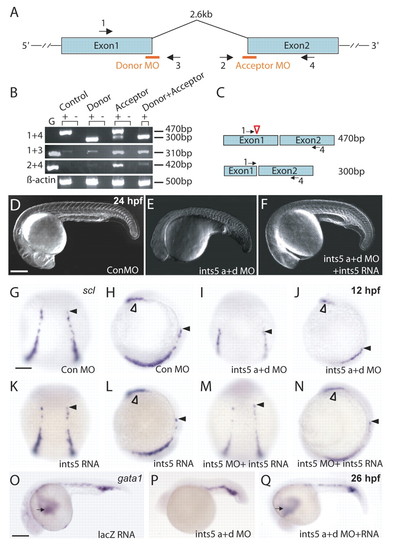
Ints5 functions during hematopoiesis. (A) Schematic representation of the ints5 genomic locus; orange bars indicate target sites of the donor and acceptor morpholinos (MOs); numbered black arrows show the position of the primers used in RT-PCRs to examine splicing of ints5 RNA. (B) RT-PCR to detect splicing of ints5 and control β-actin (encoded by bactin1). RNA from sphere stage (4 hours post fertilization, hpf) embryos injected with control or ints5 donor and acceptor morpholinos at the 1-cell stage. Primers used (left) and transcript sizes (right) are indicated. G, genomic DNA. (C) Schematic representation of correctly spliced (upper) and aberrantly spliced (lower) ints5 transcripts. The size of bands amplified by primer pair 1 and 4 is indicated on the right. Red open arrowhead indicates the position of a cryptic splice site in exon 1. (D-F) DIC images of live embryos at 24 hpf injected with control morpholinos (D), ints5 acceptor and donor (a+d) morpholinos (E) or co-injected with ints5 morpholinos and ints5 RNA (F). (G-Q) Whole-mount in situ hybridization to detect expression of scl (G-N) at 12 hpf and gata1 (O-Q) at 26 hpf shows reduced expression of both genes in ints5 morphants (I,J,P), in comparison to control morpholino- or lacZ RNA-injected embryos (G,H,O). Black arrowheads indicate the anterior limit of scl expression in the intermediate cell mass (ICM); open arrowheads indicate scl expression in the rostral blood island (RBI); black arrows indicate anterior gata1 expression, which represents the circulating blood cells. Co-injection of ints5 RNA can restore scl and gata1 expression in ints5 morphants (M,N,Q), whereas embryos injected with ints5 RNA alone show normal scl expression at 12 hpf (K,L). D-F,O-Q show lateral views of embryos with anterior to the left; G,I,K,M show dorsal views of embryos with anterior at the top; H,J,L,N show lateral views of embryos with dorsal to the right. Scale bars: 250 μm in D,O; 50 μm in G.
|
