
FIGURE
Fig. S1
- ID
- ZDB-FIG-090617-4
- Publication
- Zhao et al., 2009 - Distinct expression of two foxg1 paralogues in zebrafish
- Other Figures
- All Figure Page
- Back to All Figure Page
Fig. S1
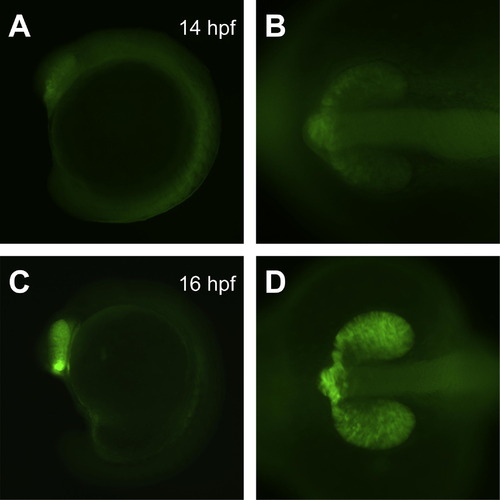
Expression of eGFP in the enhancer trap line Tg(Gal4-VP16,UAS:eGFP)cp120 at early embryonic stages. (A, B) Embryos at 14 hpf show weak eGFP expression mainly along the anterior edges of the eyes and forebrain. (C, D) The pattern of expression at 16 hpf is similar, but the fluorescence signals are stronger. Lateral views of whole embryos are shown in (A, C), and dorsal views of head regions are shown in (B, D). Orientations are with anterior to the left. |
Expression Data
Expression Detail
Antibody Labeling
Phenotype Data
Phenotype Detail
Acknowledgments
This image is the copyrighted work of the attributed author or publisher, and
ZFIN has permission only to display this image to its users.
Additional permissions should be obtained from the applicable author or publisher of the image.
Reprinted from Gene expression patterns : GEP, 9(5), Zhao, X.F., Suh, C.S., Prat, C.R., Ellingsen, S., and Fjose, A., Distinct expression of two foxg1 paralogues in zebrafish, 266-272, Copyright (2009) with permission from Elsevier. Full text @ Gene Expr. Patterns