
- Title
-
Distinct expression of two foxg1 paralogues in zebrafish
- Authors
- Zhao, X.F., Suh, C.S., Prat, C.R., Ellingsen, S., and Fjose, A.
- Source
- Full text @ Gene Expr. Patterns
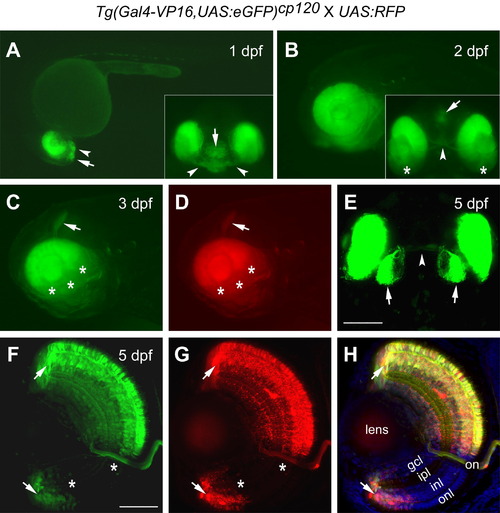
Fluorescence expression profile of the enhancer trap line Tg(Gal4-VP16,UAS:eGFP)cp120 and its ability to induce expression of a UAS:RFP transgene. Expression of eGFP and RFP was analyzed in offspring from a cross between the enhancer trap line and transgenic UAS:RFP fish. (A) A lateral view at 1 dpf shows eGFP expression mainly in retina, optic stalk (arrowhead) and ventral telencephalon (arrow). The inset is a front view of the same embryo. (B) Expression of eGFP is maintained in the retina at a later stage (2 dpf). The ventral view in the inset shows eGFP labeling of the optic nerve (arrowhead), restricted area of the forebrain (arrow), and lower level in the posterior retina (stars). (C and D) Close up views of the fluorescence detected in dorsal-nasal retina and tectum (arrow) at 3 dpf. Ventral and posterior retina show no expression (stars). RFP is transactivated under control of the UAS element and shows the same pattern as eGFP. (E) Confocal image, viewed from the dorsal side, showing eGFP labeling in the tectum (arrows) and optic nerve (arrowhead). (F–H) Confocal images of a cryosection (dorsal at the top) show the co-localization of eGFP and RFP. Both the dorsal and ventral CMZ were labeled with fluorescence (arrows). An area in the ventral retina showing no fluorescence is marked (stars). Merged image of (F) and (G), along with DAPI stained nuclei is shown in (H). The different stages are indicated. The orientation is with anterior to the left (A–D). Abbreviations: dpf, days post-fertilization; gcl, ganglion cell layer; ipl, inner plexiform layer; inl, inner nuclear layer; onl, outer nuclear layer; on, optic nerve. Scale bars: 100 μm (E); 50 μm (F–H). |
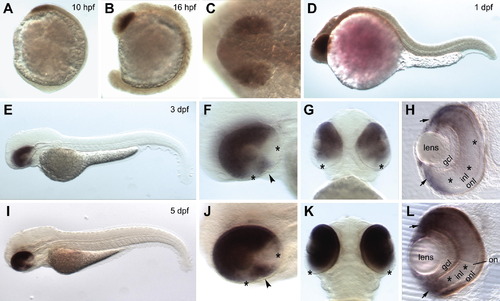
Analysis of zebrafish foxg1b expression by in situ hybridization. (A) Expression in the anterior neural plate at 10 hpf. (B) Expression is mainly restricted to the eye primordia at 16 hpf. (C) Dorsal view of the same embryo as in (B) at higher magnification. At 1 dpf, expression appears restricted in the eye (D). A lateral view (E) at 3 dpf shows expression restricted to the eye. The images in (F) and (G) show higher magnifications of the same lateral view and a ventral view, respectively. Areas lacking expression are indicated by stars (in F and G), and an arrowhead indicates expression at the choroid fissure (in F). (H) Cross-section of retina (dorsal at the top) shows expression in both dorsal and ventral CMZ (arrows), and in different layers within the dorsal retina. Stars indicate reduced expression in the ventral part of retina. (I–L) Images of the 5 dpf stage are arranged in the same way as 3 dpf (E–H). Hybridization signals persist in the dorsal-nasal retina and at the choroid fissure (arrowhead in J). Areas without staining are indicated by stars (in J and K). (L) Cross-section shows expression throughout retina including CMZ (arrows), except the ventral region marked with stars. Abbreviations: hpf, hours post-fertilization; dpf, days post-fertilization; gcl, ganglion cell layer; inl, inner nuclear layer; onl, outer nuclear layer; on, optic nerve. |
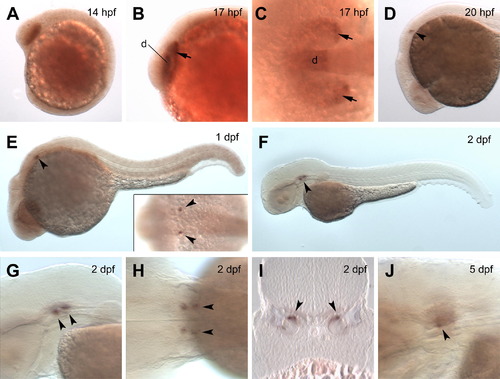
Analysis of zebrafish foxg1c expression by in situ hybridization. Transcripts are detected in the forebrain and eye primordia of embryos at 14 hpf (A) and 17 hpf (B and C). Expression at 20 hpf is mainly detected in the otic vesicles (D), and similar expression is observed at 1 dpf (E). A dorsal view (inset in E) shows expression restricted to single spots in each otic vesicle (marked by arrowheads). (F) Expression in the otic vesicles is stronger at 2 dpf. Lateral (G) and dorsal (H) views of the larva in (F) at higher magnification show expression in two spots within each of the otic vesicles. (I) Cross-section showing expression restricted to the epithelium in the inner otic vesicle at 2 dpf (orientation with dorsal up). (J) Expression becomes weaker by 5 dpf. Orientations in (A–H, J) are with anterior to the left. Expression signals are indicated with arrowheads (otic vesicles) and arrows (eye primordia). Abbreviations: d, diencephalon; dpf; days post-fertilization; hpf, hours post-fertilization. EXPRESSION / LABELING:
|
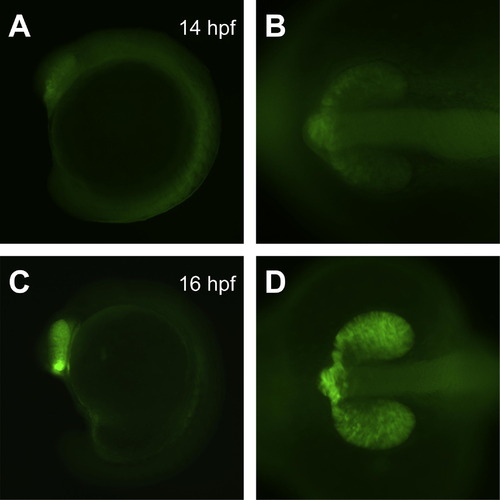
Expression of eGFP in the enhancer trap line Tg(Gal4-VP16,UAS:eGFP)cp120 at early embryonic stages. (A, B) Embryos at 14 hpf show weak eGFP expression mainly along the anterior edges of the eyes and forebrain. (C, D) The pattern of expression at 16 hpf is similar, but the fluorescence signals are stronger. Lateral views of whole embryos are shown in (A, C), and dorsal views of head regions are shown in (B, D). Orientations are with anterior to the left. |
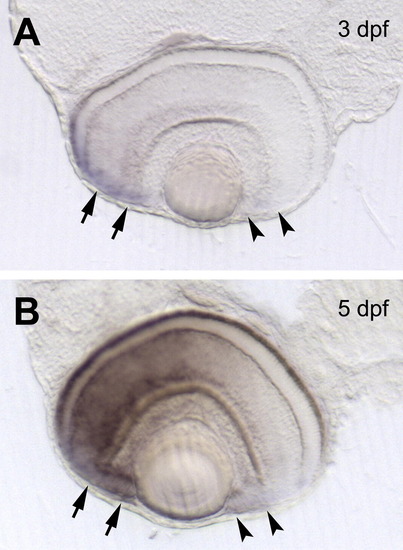
Detection of foxg1b transcripts in the retina of larvae by in situ hybridization. Horizontal sections through the middle of the retina from 3 dpf (A) and 5 dpf (B) larvae show no detectable expression of foxg1b in the posterior CMZ (marked by arrowheads) as compared to the anterior CMZ (marked by arrows). |
Reprinted from Gene expression patterns : GEP, 9(5), Zhao, X.F., Suh, C.S., Prat, C.R., Ellingsen, S., and Fjose, A., Distinct expression of two foxg1 paralogues in zebrafish, 266-272, Copyright (2009) with permission from Elsevier. Full text @ Gene Expr. Patterns