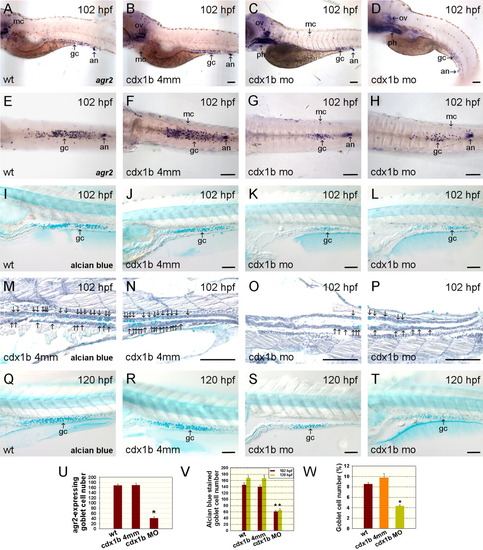
Inhibition of cdx1b function affects the development of goblet cells in the intestine. A-D: Wild type (A), cdx1b-4mm MO-injected (B), and cdx1bMO-injected (C, D) 102-hr post-fertilization (hpf) embryos were hybridized with agr2 antisense RNA probes. E-H: Wild type (E), cdx1b-4mm MO-injected (F), and cdx1b MO-injected (G, H) 102-hpf deyolked embryos that had been hybridized with agr2 antisense RNA probes. I-L: Wild type (I), cdx1b-4mm MO-injected (J), and cdx1b MO-injected (K, L) 102-hpf embryos were stained with alcian blue. M-P: Higher magnifications of alcian blue-stained paraffin sagittal sections corresponding to the mid-intestine (M, O) and posterior intestine (N, P) of 102-hpf cdx1b-4mm MO-injected (M, N) and cdx1b MO-injected (O, P) embryos. Arrows indicate locations of alcian blue-stained goblet cells in the intestine. Q-T: Wild type (Q), cdx1b-4mm MO-injected (R), and cdx1b MO-injected (S, T) 120-hpf embryos were stained with alcian blue. U: Comparison of agr2-expressing goblet cell numbers in the intestine of 102-hpf wild type (n = 28), cdx1b-4mm MO-injected (n = 28), and cdx1b MO-injected (n = 21) embryos. V: Comparison of alcian blue-stained goblet cell numbers in the intestine of wild type (n102 = 20; n120 = 21), cdx1b-4mm MO-injected (n102 = 23; n120 = 21), and cdx1b MO-injected (n102 = 22; n120 = 23) embryos from 102 (red bars) and 120 hpf (green bars). W: Comparison of the percentages of intestinal goblet cell numbers reveals decreased goblet cell numbers in cdx1b MO-injected (n = 7) embryos compared to wild type (n = 5) and cdx1b-4mm MO-injected (n = 5) embryos. Error bars indicate standard errors. Student's t-test was conducted to compare cdx1b MO-injected embryos with either wild type or cdx1b-4mm MO-injected embryos. *P < 0.001 in both comparisons. An, anus; gc, goblet cell; mc, mucus cell; ov, otic vesicle; ph, pharynx. Scale bars = 100 μm.
|
