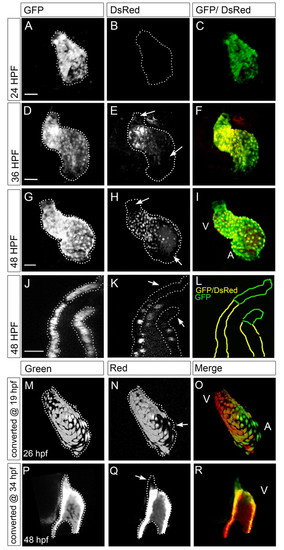
Delayed cardiomyocyte differentiation first arises at the venous pole and later also contributes cells to the arterial pole. (A-I) Developmental timing assay images: reconstruction of confocal z-stacks of eGFP (A,D,G), DsRed (B,E,H), and overlay (C,F,I) from Tg(cmlc2:eGFP)/Tg(cmlc2:dsred2-nuc) embryos. The arterial pole is to the top left; dotted lines outline the eGFP positive heart tubes. Scale bars: 50 μm. (A-C) At 24 hpf, eGFP fluorescence was visible in the entire heart tube. At this time point, no DsRed fluorescence was observed. (D-F) At 36 hpf, the eGFP fluorescence was visible in the entire heart tube. DsRed fluorescence was detected only in the ventricle and at the inner curvature of the atrium. Arrows indicate the regions in the heart tube that are negative for the DsRed signal. (G-I) At 48 hpf, both GFP and DsRed fluorescence were observed in the heart tube. The DsRed signal remained absent from the poles (arrows), which were positive for eGFP. (J,K) Single confocal scan from Tg(cmlc2:GFP)/Tg(cmlc2:dsred2-nuc) embryos at 48 hpf at the level of the arterial pole. Dotted lines indicates the eGFP signal shown in J; arrows in K indicate the most distal outflow tract cells that are positive for eGFP but negative for DsRed. The signal within the heart lumen detected in K but not in J is derived from background fluorescence from red blood cells. Scale bar: 25 μm. (L) Schematic of the location of the eGFPposDsRedpos cells (yellow) and the eGFPposDsRedneg (green) cells in the arterial pole. (M-R) Reconstruction of confocal z-stacks of Tg(cmlc2:Kaede) embryos with the arterial pole of the heart tube to the top. (M-O) Tg(cmlc2:Kaede) embryos photoconverted at 19 hpf and imaged at 26 hpf with the green unconverted signal shown in gray in M, the converted red signal in gray in N and a merged image in O. The arrow indicates the location of atrial cells that are green but not red, indicating that they were not expressing the transgene at the time of photoconversion. The dotted line indicates the green signal at 26 hpf. V, ventricle; A, atrium. (P-R) Tg(cmlc2:Kaede) embryos photoconverted at 34 hpf and imaged at 48 hpf with the green unconverted signal shown in gray in P, the converted red signal in gray in Q and a merged image in R. Images are of a partial reconstruction of confocal z-stacks, allowing a view into the ventricle chamber. The dotted line indicates the green signal at 48 hpf; the arrow in Q indicates the location of distal outflow tract cells that are green but not red, indicating that they were not expressing the transgene at the time of photoconversion.
|
