
FIGURE
Fig. 7
- ID
- ZDB-FIG-090408-24
- Publication
- Chan et al., 2009 - Noninvasive technique for measurement of heartbeat regularity in zebrafish (Danio rerio) embryos
- Other Figures
- All Figure Page
- Back to All Figure Page
Fig. 7
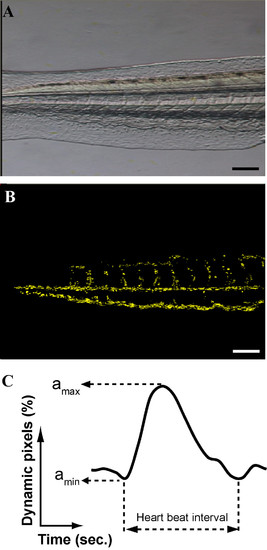
Diagram showing the caudal region of embryo to be analyzed (A) and the result image of subtraction between 2 consecutive video frames (B) with yellow pixels representing the dynamic pixels. Schematic diagram illustrated the parameters being analyzed in the signal of dynamic pixels (C). amax: maximum value of dynamic pixels; amin: minimum value of dyannmic pixels; heart beat interval: the time for a complete heart beat between 2 toughs; Scale Bar: 50 μm; Right to anterior (head). |
Expression Data
Expression Detail
Antibody Labeling
Phenotype Data
Phenotype Detail
Acknowledgments
This image is the copyrighted work of the attributed author or publisher, and
ZFIN has permission only to display this image to its users.
Additional permissions should be obtained from the applicable author or publisher of the image.
Full text @ BMC Biotechnol.