
Fig. 5
- ID
- ZDB-FIG-090310-9
- Publication
- Buckles et al., 2004 - Combinatorial Wnt control of zebrafish midbrain-hindbrain boundary formation
- Other Figures
- All Figure Page
- Back to All Figure Page
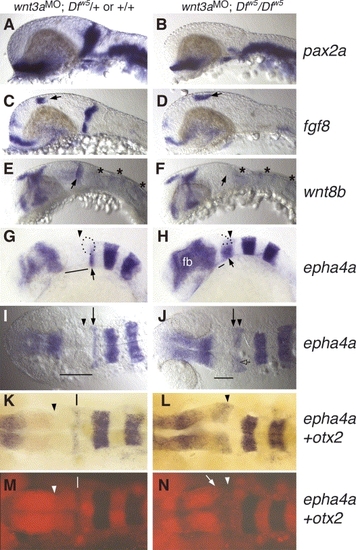
Loss of MHB gene expression in wnt3aMO;Dfw5/Dfw5 embryos at 24–27 hpf. In situ probes used are indicated to the right of each row. All panels: anterior to the right. (A–H) Lateral views. (I–N) Dorsal views. (A,C,E,G,I,K,M) Wild type or Dfw5/+embryos injected with wnt3a MO. (B,D,F,H,J,L,N) Dfw5 homozygous siblings injected with wnt3a MO. (A,B) pax2a is absent specifically in the MHB domain. Optic stalk and hindbrain neuron expression is unaffected. (C,D) fgf8 also is absent in the MHB of wnt3aMO;Dfw5/Dfw5 embryos, while dorsal diencephalon (arrows), heart, optic stalk and telencephalic expression is unaffected. (E,F) wnt8b expression in the MHB is completely absent. r1, r3 and r5 expression is still visible in wnt3aMO;Dfw5/Dfw5 embryos (asterisks), and r1 expression abuts the caudal edge of the midbrain (arrow). (G,H) Slightly oblique views. epha4a is normal in r3 and r5, but r1 expression is expanded in wnt3aMO;Dfw5/Dfw5 (arrow). In wild-type embryos, the cerebellum lies dorsal to the basal r1 domain (dotted outline), but this position in wnt3aMO;Dfw5/Dfw5 embryos (dotted line) is occupied by tissue that is not morphologically identifiable. Note also the reduced tegmentum (solid line) recognized as the space between r1 and forebrain (fb) domains of epha4a expression. Forebrain expression of epha4a is increased in some wnt3aMO;Dfw5/Dfw5 embryos, although this is variable among embryos. (I,J) Dorsal views to illustrate position of r1 epha4a stripe (arrow) in relation to the posterior edge of the midbrain (arrowhead). In (J), the arrow is placed at the anterior edge of epha4a. Note that the r1 epha4a domain lies underneath the dorsal brain tissue (open arrow). Lines indicate length of midbrain and rostral hindbrain region. (K–N) Double in situ hybridization for epha4a (blue) and otx2 (red). (K,L) Bright field image. (M,N) Fluorescent images (Fast red) of the embryos in K,L. Arrowheads indicate the caudal edge of otx2 expression. In wild-type, the space between otx2 and r1 epha4a expression (vertical lines in panels K,M) defines the region referred to as r0 by Waskiewicz et al. (2002), which includes the cerebellum anlage. Note the substantially reduced intensity of otx2 expression in the wnt3aMO;Dfw5/Dfw5 embryo, especially at its caudal edge (arrow in N), and the r1 epha4a domain sits below the caudal edge of otx2. Arrowheads in (G–N) indicate equivalent positions, which is the posterior edge of otx2 expression in each genotype. |
| Fish: | |
|---|---|
| Knockdown Reagent: | |
| Observed In: | |
| Stage: | Prim-5 |
Reprinted from Mechanisms of Development, 121(5), Buckles, G.R., Thorpe, C.J., Ramel, M.C., and Lekven, A.C., Combinatorial Wnt control of zebrafish midbrain-hindbrain boundary formation, 437-447, Copyright (2004) with permission from Elsevier. Full text @ Mech. Dev.