
Fig. S1
- ID
- ZDB-FIG-090220-33
- Publication
- Baxendale et al., 2009 - Expression screening and annotation of a zebrafish myoblast cDNA library
- Other Figures
- All Figure Page
- Back to All Figure Page
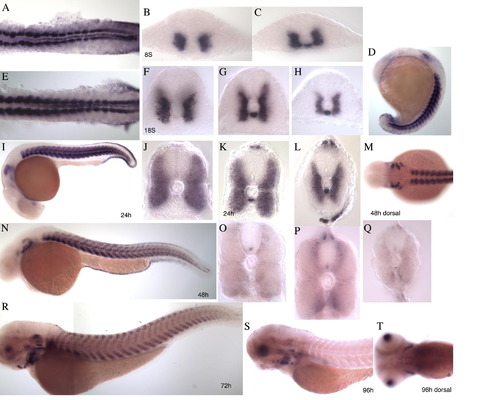
Additional in situ expression images of the transcripts, (A) ZFmu1D10s, (B) a2bp1l, (C) dlat. (A) ZFmu1D10s WISH staining of zebrafish embryos at the following stages. (A and E) Flat mounted embryos at 13 and 18 somite stages, respectively. Expression is seen in the adaxial cells and in the posterior of the hypochord. By 18 somites the expression of ZFmu1D10s in the anterior somites has expanded laterally. (B and C) Sections taken through an 8 somite embryo in the anterior (B) and posterior (C) showing expression in the adaxial cells and in the posterior hypochord, beneath the notochord in (C). (D) Lateral view of 17 somite stage embryo showing expression in the somite, hypochord and otic vesicle. F,G,H, Sections through an 18 somite embryo, anterior to posterior, showing the expansion of ZFmu1D10s expression in the most anterior somites (F) compared to the posterior section (H). The expression expands as the slow myoblasts migrate to the surface. I, 24 hpf embryo showing expression in the somite, otic vesicle, branchial arches, hypothalamus and epidermis. (J–L) Transverse sections through the 24 hpf embryo, anterior (J) to posterior (L). (M) Dorsal view of head at 48 hpf showing expression in the branchial arches and somites. N, Lateral view of 48 hpf embryo with expression in the somite, epidermis, otic vesicle and branchial arches. (O–Q) Transverse section of 48 hpf embryo, anterior to posterior. (R) 72 hpf embryo with weaker expression in the somite, stronger expression in the ear, head regions and eye. S, No expression in the somite, reduced expression in the head and eye. (T) Dorsal view of (S). (B) a2bp1l WISH staining of zebrafish embryos at the following stages (A and E). Flat mounted embryos at 8 and 15 somite stage, respectively. Expression is found in the adaxial cells and the posterior cells of the somite. (B and C) Dorsal and lateral view of a 2 somite stages embryo showing expression in the adaxial cells only. (D) Lateral view of 12 somite stage embryo showing expression in the somite and heart field. (F and G) Transverse sections of anterior (F) and posterior (G) regions of a 15 somite stage embryo showing strong expression in the adaxial cells and weaker expression throughout the lateral region of the somite. (H) 24 hpf embryo showing strong expression in the somite and heart. (I–L) Transverse sections through 24 hpf embryo, anterior through to posterior. (M) 48 hpf embryo with strong staining in the somite and heart an weaker staining appearing in the first head muscles. (N–P) Transverse sections through 48 hpf embryo. The anterior section (N) shows discrete areas of staining surrounded by areas not expressing a2bp1l. (Q) 72 hpf embryo with expression in the somite, heart and head musculature. (R) Higher magnification (40x) of the boxed region in Q showing nuclear staining. (S) Dorsal view of head region in (Q). (T) 96 hpf embryo, showing weaker expression in the somites and head muscles. (U) Dorsal view of head region in (T). (V and W) Transverse section of 96 hpf embryo, anterior and posterior, respectively, showing the central nuclear staining within the myotube. (C) 39/dlat WISH staining of zebrafish embryos at the following stages (A and B). Flat mounted embryos at the 6 somite and 14 somite stage, respectively. Stronger expression in seen in the adaxial cells and epidermis above a basal level of expression. (C and D) Transverse section through 14 somite stage embryo showing adaxial expression which is weaker by 14 somite stage. (E and F) Lateral view of 6 and 16 somite stage embryos, expression in the somites and also in the eye of the 16 somite stage embryo can be seen. (G) Lateral view of 24 hpf embryo with expression in the somite, pronephric duct and eye. (H–J) Transverse sections through 24 hpf embryo, anterior to posterior, showing expression throughout the somite, with stronger expression towards the periphery. K, 48 hpf embryo with expression in the pectoral fins, and ventral region of the somite. Weak staining is seen in the head. (L) Tailview of 48 hpf embryo. (M) Dorsal view of 48 hpf embryo. (N and O) Transverse section of 48 hpf embryo showing ventral and lateral expression. (P) 72 hpf embryo. (Q–S) 96 hpf embryo. Expression is seen in the head, eye, pectoral fins and very weakly in the somite. |
| Gene: | |
|---|---|
| Fish: | |
| Anatomical Terms: | |
| Stage Range: | 5-9 somites to Day 4 |
Reprinted from Gene expression patterns : GEP, 9(2), Baxendale, S., Chen, C.K., Tang, H., Davison, C., Hateren, L.V., Croning, M.D., Humphray, S.J., Hubbard, S.J., and Ingham, P.W., Expression screening and annotation of a zebrafish myoblast cDNA library, 73-82, Copyright (2009) with permission from Elsevier. Full text @ Gene Expr. Patterns