|
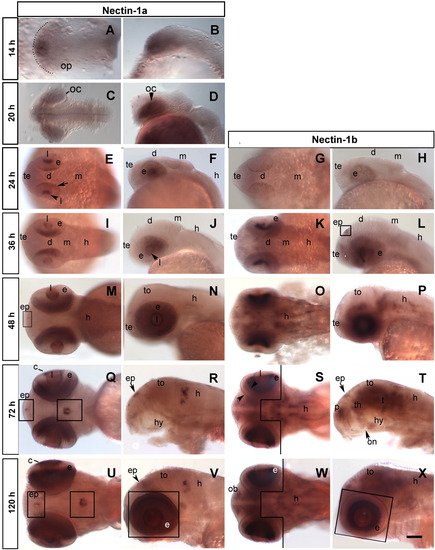
Expression of the nectin-1a and nectin-1b genes in whole mounts of zebrafish at various hours post fertilization (hpf). The stages are indicated to the left and the genes on the top. All preparations are shown in both dorsal (A, C, E, G, I, K, M, O, Q, S, U, W) and lateral views (B, D, F, H, J, N, P, R, T, V, X). The eyes, which are marked with squares in R and T, were removed in N and P. The smaller boxes in M and Q show nectin-1a expression in the brain. Composite images are presented in O and S where the focus planes to the left of the lines were more ventral (lower) than those to the right. c, cornea; d, diencephalon; e, eye; h, hypothalamus; l, lens; m, midbrain; oc, optic; on, optic nerve; op, optic primordial; p, pallium cup; s, subpallium; t, tegumentum; te, telencephalon; th, thalamus; to, tectum opticum. Scale bar = 100 μm.
|