
Fig. 3
- ID
- ZDB-FIG-081219-6
- Publication
- Hu et al., 2008 - Retinoid regulation of the zebrafish cyp26a1 promoter
- Other Figures
- All Figure Page
- Back to All Figure Page
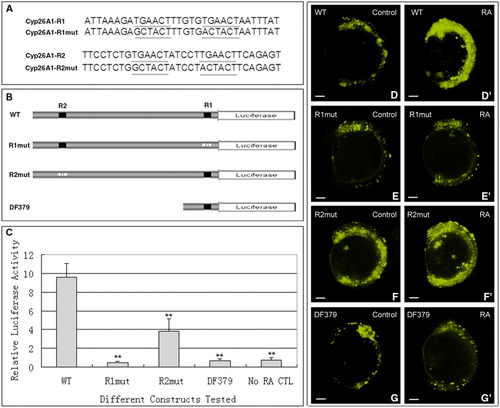
In vitro and in vivo assays showing that the two retinoic acid response elements (RAREs) are required for retinoic acid (RA) inducibility of cyp26a1 gene. A: Sequences of wild-type and mutated RAREs of zebrafish cyp26a1 promoter. The core sequences of wild-type RARE and mutated RAREs are underlined. R1 and R2 represent the proximal and the distal site RARE of cyp26a1 promoter, respectively. B: Schematic diagram showing the different promoter fragments of cyp26a1 gene driving luciferase reporter gene. WT: the 2.5 k fragment with wild-type R1 and R2; R1mut: the 2.5 k fragment with mutated R1 and normal R2; R2mut: the 2.5 k fragment with mutated R2 and normal R1; DF379: truncated fragment with only 379 bp of 2,533 bp. C: Luciferase activity assay showing that R1 and R2 are required for the RA-inducible activity of zebrafish cyp26a1 promoter. X-axis: the different promoter fragments shown in (B) are examined for their RA inducibilities. The activities of WT, R1mut, R2mut, and DF379 fragments were tested at 100 nM RA. No RA CTL represents that the activity of WT is measured when there is no RA treatment. Y-axis: the relative luciferase activity. Units represent ratios of luciferase activity to control renilla luciferase activity for each sample. Mutating either of two RARE sites or truncating promoter fragment with only R1 present results in that the RA-inducible activities of the promoter fragments are significantly lower than that of wild-type 2.5 k promoter fragment (**P < 0.01). D-G,D′-G′: In vivo transient expression assay showing the activities of the fragments with different lengths or mutations of cyp26a1 regulatory sequence. The linearized constructs of p2.5kcyp26a1pr_eYFP (WT) (D, D′), pR1mut_eYFP (E,E′), pR2mut_eYFP (F,F′), and pDF379_eYFP (G,G′) were microinjected into 1- to 4-cell stage embryos, respectively. The injected eggs were grown to 6 hours postfertilization (hpf) and then treated with 100 nM RA for 6 hr for examining the transient eYFP expression at 12 hpf (D′: WT; E′: R1mut; F&prime: R2mut; G′: DF379). The injected embryos incubated at 0.1% dimethyl sulfoxide (DMSO) were used as control (D, WT; E, R1mut; F, R2mut; G, DF379). Embryos are laterally viewed and positioned anterior top. Fluorescent images are photographed by the DP70 digital camera (Olympus, Japan) with 10-sec exposure time. Scale bar = 100 μm. |