
Fig. 4
- ID
- ZDB-FIG-081105-18
- Publication
- Lewis et al., 1999 - Control of muscle cell-type specification in the zebrafish embryo by hedgehog signalling
- Other Figures
- All Figure Page
- Back to All Figure Page
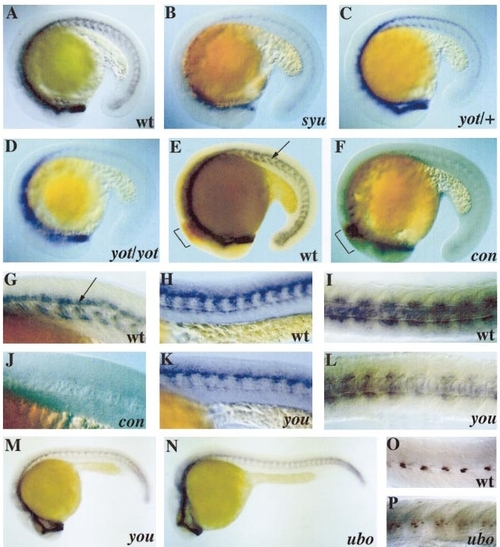
Expression of ptc1 at late somitogenesis stages in wild-type and mutant embryos. Specimens are oriented dorsal side up, anterior to the left unless otherwise stated. (A–G and J) 18- to 20-somite stage embryos; (H, I, and K–P) embryos at 26–30 somites. Specimens in E–G were stained with mAb 4D9 to reveal the expression of Eng proteins: arrows indicate Eng expression in MPs; square brackets indicate Eng expression in the midbrain/hindbrain region. (A) Wild-type expression of ptc1; (B) syu and (D) yot homozygotes showing strong reduction in ptc1 expression. The specimen in (C) showing a slight reduction in ptc1 expression is presumed to be a yot heterozygote. (F) con homozygote, identified by the lack of somitic Eng expression (compare to the wild-type sibling shown in (E)), exhibiting a strong reduction in ptc1 expression. (G and J) Details of embryos shown in (E and F) illustrating the simultaneous loss of ptc1 expression and loss of muscle pioneers in con homozygotes. Lateral (H and K) and dorsal (I and L) views of wild-type and you homozygous embryos showing reduction in expression of ptc1 in somites and neural tube, also shown at lower magnification in (M). (N) ubo homozygote at same stage as (M) showing normal expression of ptc1. (O) Lateral view of trunk region of a 26- to 30-somite stage wild-type embryo stained with mAb 4D9 to reveal Eng expressing MPs. Each somite has a small number (1–5) of cells that express high levels of Eng proteins located in the middle of the somite adjacent to the notochord. (P) ubo homozygotes do not form MPs but have clusters of cells expressing lower levels of Eng similar to those that surround MPs in wild-type embryos: note that this embryo was stained longer than that shown in (O) to reveal the lower level Eng staining. |
| Gene: | |
|---|---|
| Antibody: | |
| Fish: | |
| Anatomical Terms: | |
| Stage Range: | 14-19 somites to 26+ somites |
Reprinted from Developmental Biology, 216(2), Lewis, K.E., Currie, P.D., Roy, S., Schauerte, H., Haffter, P., and Ingham, P.W., Control of muscle cell-type specification in the zebrafish embryo by hedgehog signalling, 469-480, Copyright (1999) with permission from Elsevier. Full text @ Dev. Biol.