FIGURE

Fig. 3

ID
ZDB-FIG-080910-28
Publication
García-Lecea et al., 2008 - In vivo Analysis of Choroid Plexus Morphogenesis in Zebrafish
Other Figures
All Figure Page
Back to All Figure Page
Fig. 3

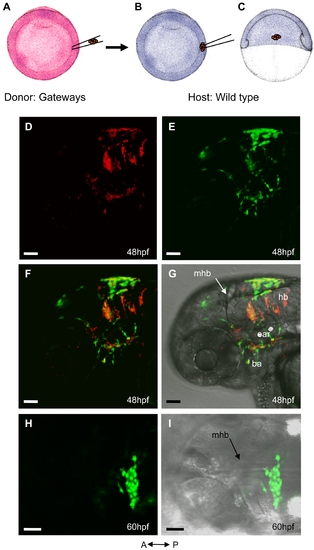
Lineage analysis of ChP.
Transplantation was performed at 6hpf and the outcome was visualized at 48hpf (n = 5) and 60hpf (n = 4). A–C, schematic of the transplantation experiment. A,B, drawing of the animal view of 6hpf embryos. C, drawing of the lateral view of a 6hpf embryo. A, Texas Red-injected Gateways donor. B,C, wild type host. D–G, lateral view of 48hpf host embryo. D, Texas Red-labelled descendants of transplanted cells. E, GFP positive descendants of transplanted cells. F, merged D&E. G, merged F & bright field image. H,I, dorsal view of 60hpf host embryo. H, cluster of GFP-positive cells in the roof of fourth ventricle. I, merged H & bright field image. Abbreviations: ba – branchial arch, hb – hindbrain, mhb - midbrain-hindbrain boundary.

Expression Data

Expression Detail
Antibody Labeling
Phenotype Data

Phenotype Detail
Acknowledgments
This image is the copyrighted work of the attributed author or publisher, and ZFIN has permission only to display this image to its users. Additional permissions should be obtained from the applicable author or publisher of the image. Full text @ PLoS One