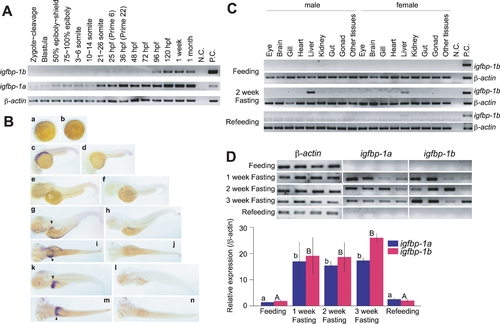
Temporal and spatial expression patterns of igfbp-1a and igfbp-1b during zebrafish embryogenesis.
A) RT-PCR analysis result. The developmental stages are shown at the top, hpf, hour post fertilization. B) In situ hybridization analysis of IGFBP-1b mRNA. Embryos of 5-somite (a, b), prim.5 straightening period (c, d), the long bud stage (e, f), 120 hpf hatched embryos (g, h, I, j) and 196 hpf hatched embryos (k, l, m, n) were analyzed. Shown in panels a, c, e, g, i, k and m are embryos probed with the antisense riboprobe. In panels b, d, f, h, j, l and n, embryos probed with sense riboprobe are shown. Panels a–f, k and l are lateral views with the head to the left, and panels i, j, m and n are corresponding dorsal views of panels g, h, k and l, respectively. IGFBP-1b mRNA signals were weakly detectable in the liver at 48 hpf, and highly expressed in the liver of 120 and 196 hpf embryos (indicated by arrowheads). C) Tissue distribution of igfbp-1b mRNA in male and female adult fish. Matured adult male and female fish were sampled at the beginning of the experiment (Feeding), after fasting for 2 weeks (2 week Fasting) or 2 week fasting followed by 1 week re-feeding (Refeeding). RNA was extracted from various tissues and subjected to RT-PCR analysis. D) Nutritional regulation of IGFBP-1a and -1b mRNA levels in adult zebrafish.Total RNA was isolated from adult fish at the beginning of the experiment (Feeding), after fasting for 1 week (1 week Fasting), 2 weeks (2 week Fasting), 3 weeks (3 week Fasting), or refed for a week after a 2 week fasting (Refeeding). RNA was subjected to RT-PCR analysis and a representative RT-PCR result is shown in the upper panel. The relative levels of IGFBP-1a and -1b mRNA were measured and normalized by corresponding b-actin signals and shown in the bottom panel. Values are mean±S.E. (n = 4). Values marked with different letters (a and b, or A and B) are significantly different from each other (p<0.05).
|
