FIGURE SUMMARY
Title

Duplication and Diversification of the Hypoxia-Inducible IGFBP-1 Gene in Zebrafish

Authors
Kamei, H., Lu, L., Jiao, S., Li, Y., Gyrup, C., Laursen, L.S., Oxvig, C., Zhou, J., and Duan, C.
Source
Full text @ PLoS One

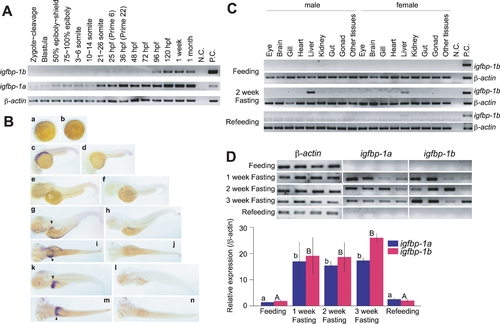
Temporal and spatial expression patterns of igfbp-1a and igfbp-1b during zebrafish embryogenesis.
A) RT-PCR analysis result. The developmental stages are shown at the top, hpf, hour post fertilization. B) In situ hybridization analysis of IGFBP-1b mRNA. Embryos of 5-somite (a, b), prim.5 straightening period (c, d), the long bud stage (e, f), 120 hpf hatched embryos (g, h, I, j) and 196 hpf hatched embryos (k, l, m, n) were analyzed. Shown in panels a, c, e, g, i, k and m are embryos probed with the antisense riboprobe. In panels b, d, f, h, j, l and n, embryos probed with sense riboprobe are shown. Panels a–f, k and l are lateral views with the head to the left, and panels i, j, m and n are corresponding dorsal views of panels g, h, k and l, respectively. IGFBP-1b mRNA signals were weakly detectable in the liver at 48 hpf, and highly expressed in the liver of 120 and 196 hpf embryos (indicated by arrowheads). C) Tissue distribution of igfbp-1b mRNA in male and female adult fish. Matured adult male and female fish were sampled at the beginning of the experiment (Feeding), after fasting for 2 weeks (2 week Fasting) or 2 week fasting followed by 1 week re-feeding (Refeeding). RNA was extracted from various tissues and subjected to RT-PCR analysis. D) Nutritional regulation of IGFBP-1a and -1b mRNA levels in adult zebrafish.Total RNA was isolated from adult fish at the beginning of the experiment (Feeding), after fasting for 1 week (1 week Fasting), 2 weeks (2 week Fasting), 3 weeks (3 week Fasting), or refed for a week after a 2 week fasting (Refeeding). RNA was subjected to RT-PCR analysis and a representative RT-PCR result is shown in the upper panel. The relative levels of IGFBP-1a and -1b mRNA were measured and normalized by corresponding b-actin signals and shown in the bottom panel. Values are mean±S.E. (n = 4). Values marked with different letters (a and b, or A and B) are significantly different from each other (p<0.05).

EXPRESSION / LABELING:
Genes:
Fish:
Condition:
Anatomical Terms:
Stage Range: 1-cell to Adult

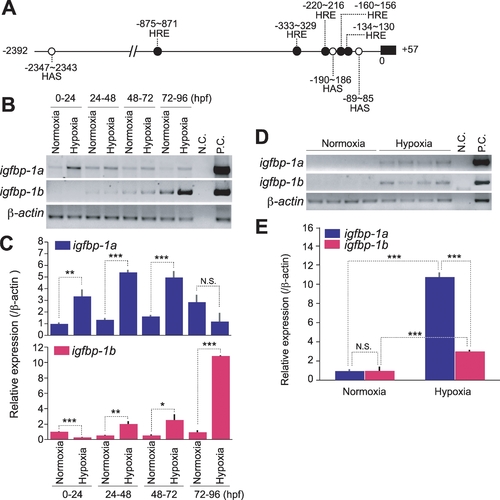
The expression levels of igfbp-1a and igfbp-1b are differentially regulated by hypoxia.
A) Schematic diagram of the 5′-flanking region of igfbp-1b. 2,347 bp before the start codon are shown. 5 hypoxia response elements (HRE: ●) and 3 hypoxia inducible factor-1 (HIF-1) ancillary sequences (HAS: ○) are found in this region. B,C) Effects of hypoxia in developing zebrafish embryos. 0, 24, 48, and 72 hpf embryos were subjected to 24 h hypoxia as described in Materials and Methods. Total RNA was isolated and subjected to RT-PCR and qRT-PCR analysis. Representative RT-PCR results are shown in the upper panel B). IGFBP-1a and -1b mRNA levels were further analyzed by qRT-PCR and are expressed as relative value to those of the normoxia groups C). Data shown are means±S.E. of three independent experiments. *p<0.05, **p<0.01 compared to the normoxia group at the same time point. D, E) Hypoxia increases IGFBP-1a and -1b mRNA levels in adult fish. Total RNA was isolated from individual zebrafish that were kept in normaxia or intermediate hypoxia for 6 h. Representative RT-PCR results are shown in the upper panel D). qRT-PCR data are expressed as relative values to those of the normoxia group and shown in the lower panel E). Data shown are means±S.E. of three independent experiments. *p<0.05, **p<0.01 compared to each group.

EXPRESSION / LABELING:
Genes:
Fish:
Condition:
Anatomical Term:
Stage Range: 1-cell to Adult

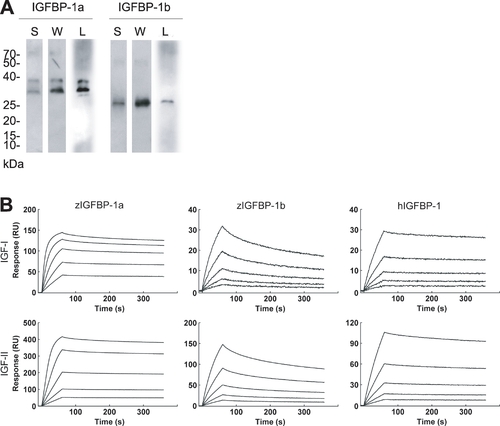
Zebrafish IGFBP-1a and -1b proteins have different IGF binding affinities and kinetics.
A) Purification and characterization of zebrafish IGFBP-1a and -1b proteins. Isolated IGFBP-1a and -1b proteins were analyzed by SDS-PAGE under non-reducing condition, followed with Silver staining (S), western blotting (I) and western ligand-blotting (L). 1.0 (S) or 0.3 μg (W and L) purified protein was loaded to each lane. (B) BIAcore analysis of IGFBP1a and -1b. All binding experiments were carried out at 25°C in HBS buffer with a constant flow rate of 30 μL/min. Different concentrations of zebrafish IGFBP-1a and -1b or human IGFBP-1 were injected over the surface for 60 seconds followed by a five minute dissociation period. The sensor surface was regenerated by two 30 second injections of HCl (100 mM). Sensorgram data were analyzed using the BIAcore T100 evaluation Software version 1.1. Concentrations of IGFBP-1a applied were 144 nM, 72 nM, 36 nM, 18 nM and 9 nM, IGFBP-1b were 173 nM, 86.4 nM, 43.2 nM, 21.6 nM and 10.8 nM and human IGFBP-1 were 368 nM, 184 nM, 92 nM, 46 nM and 23 nM.

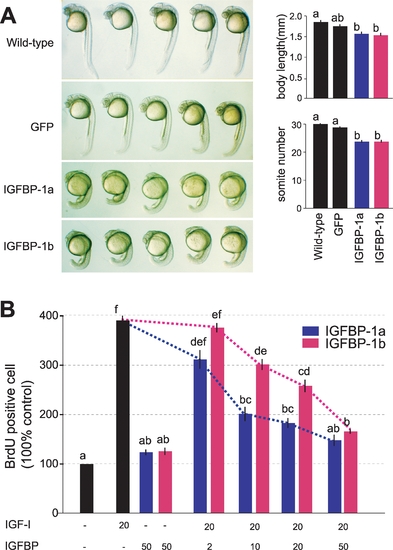
Zebrafish IGFBP-1a and IGFBP-1b are both functional but have different activities.
A) Expression of IGFBP-1a and -1b reduces embryo growth and developmental rate in vivo. GFP mRNA (600 pg/embryo), a mixture of IGFBP-1a mRNA (400 pg/embryo) and GFPmRNA (200 pg/embryo), or IGFBP-1a mRNA (400 pg/embryo) and GFP mRNA (200 pg/embryo) was injected into 1–2 cell stage embryos. The embryos were raised to 24 hpf and body length and somite number were determined. Representative embryos are shown in the left column. Body length and somite number of each experimental group are shown in the left column. Values are represented as means±S.E. (n = 21–29). Groups with common letters are not significantly different from each other (p<0.05). B) Effects of IGFBP-1a and -1b on IGF-I-stimulated cell proliferation in cultured zebrafish cells. Serum starved confluent cells were exposed to the media with or without 20 nM IGF-I in the absence or presence of various concentrations of IGFBP-1s (2, 10, 20 or 50 nM). To evaluate IGF-independent effect, cells are exposed with 50 nM of IGFBP-1s without IGF. The percentage of BrdU-positive cells in each group was calculated and is shown. Values are means±S.E. (n = 3∼6). Groups with common letters are not significantly different from each other (p<0.05).

Acknowledgments
This image is the copyrighted work of the attributed author or publisher, and ZFIN has permission only to display this image to its users. Additional permissions should be obtained from the applicable author or publisher of the image. Full text @ PLoS One