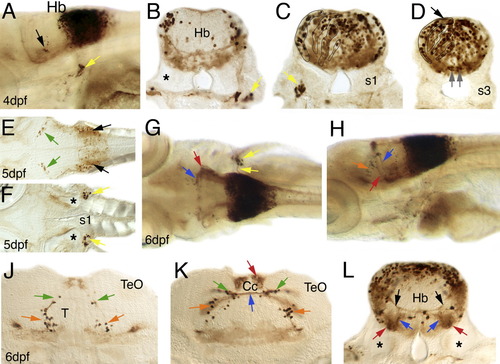
Anti-YFP staining of the hoxd4a enhancer detection line, at 4 dpf (A-D), 5 dpf (E, F), 6 dpf (G-L). The arrows have the following color code. Red, blue: 2 different precerebellar fiber tracts; orange: cells in ventral tegmentum; green: cells in cerebellum; yellow: vagal nerve and vagal ganglion. The black and grey arrows are explained in the text. A: YFP distribution in the posterior hindbrain. The black arrow marks cells in the anterior hindbrain. B-D: Transverse sections through a 4-dpf larva from anterior to posterior. The black arrows indicate neuroepithelial cells and the grey arrows two symmetrical clusters of neurons. The hindbrain neurons followed tangential stripes (framed by a black line). E,F: Horizontal sections through a 5-dpf larva on the level of the dorsal (E) and ventral (F) hindbrain. Black arrows point to YFP-positive cells in the hindbrain. G,H: Whole mount stained larva at 6 dpf with YFP expression in the posterior hindbrain. J-L: Transverse sections through a 6-dpf larva in a row from anterior to posterior. Black arrows mark contralaterally projecting hindbrain neurons. The asterisk marks the inner ear. Cc, corpus cerebelli; H, hypothalamus; Hb, hindbrain; s, somite; T, midbrain tegmentum; TeO, tectum opticum.
|
