
Fig. 2
- ID
- ZDB-FIG-080702-24
- Publication
- Angotzi et al., 2008 - Independent and dynamic reallocation of pitx gene expression during vertebrate evolution, with emphasis on fish pituitary development
- Other Figures
- All Figure Page
- Back to All Figure Page
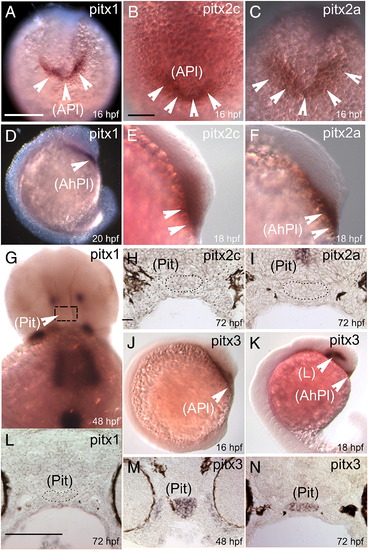
Expression patterns of pitx1, pitx2a, pitx2c and pitx3 genes during zebrafish pituitary development. Stages are indicated on the lower-right corner of each panel. Expression domains are marked by arrows in the following structures: anterior placode (APl), adenohypophyseal placode (AhPl), lens (L), pituitary (Pit). Note the loss of expression in the pituitary at late developmental stages (48 and 72 hpf), for pitx1, pitx2c and pitx2a genes (G,L, H and I, respectively). In Fig. 2G, the area where the gland should appear if marked with pitx1 is indicated by the dash-lined box. Scale bar for (A,D,J,K) and (G) = 200 μm; (B,C,E,F) and (L–N) = 100 μm; (H,I) = 50 μm. |
| Genes: | |
|---|---|
| Fish: | |
| Anatomical Terms: | |
| Stage Range: | 14-19 somites to Protruding-mouth |
Reprinted from Gene, 417(1-2), Angotzi, A.R., Ersland, K.M., Mungpakdee, S., Stefansson, S., and Chourrout, D., Independent and dynamic reallocation of pitx gene expression during vertebrate evolution, with emphasis on fish pituitary development, 19-26, Copyright (2008) with permission from Elsevier. Full text @ Gene