
Fig. 8
- ID
- ZDB-FIG-080701-6
- Publication
- Ul-Hussain et al., 2008 - IRES-mediated translation of the carboxy-terminal domain of the horizontal cell specific connexin Cx55.5 in vivo and in vitro
- Other Figures
- All Figure Page
- Back to All Figure Page
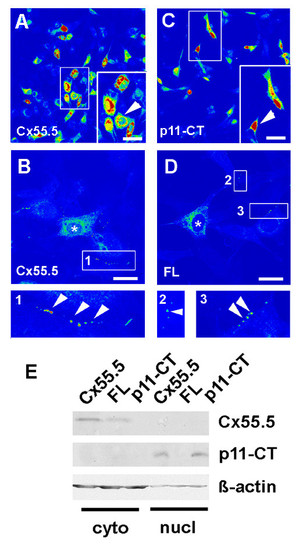
Subcellular localization of the Cx55.5 protein isoforms in vitro. The subcellular distribution of FLAG tagged Cx55.5, FL and p11-CT proteins was determined by immunocytochemistry. All constructs were transiently expressed in NIH3T3 cells. Confocal images were collected using the LSM510 Meta system and software. Pictures shown represent single optical planes which are presented in pseudocolours for better representation of the staining intensity. Red label indicates maximal concentration. A, B) Wild-type Cx55.5 construct (WT) co-expressing the full length Cx55.5-FLAG and p11-CT-FLAG fusion proteins. (magnification in A: 40x, Scale bar = 30 μm; in B: 63x magnification, Scale bar = 15 μm). Highest concentrations occur in perinuclear regions and the nucleus. B) Higher magnification of the WT construct with a ROI (1) showing punctuate membrane label. C) FLAG-tagged p11-CT with maximal concentration in the nuclei. The arrowheads in the inset indicates the characteristic nuclear localization of p11-CT. (magnification: 40x; Scale bar 30 μm). D) FLAG-tagged FL protein encoding for the full length Cx55.5 protein only (magnification 63x, Scale bar: 15 μm). Besides lack of nuclear staining plaque-like protein assemblies occur at sites of cell contacts (indicated by arrowheads in inset 2 and 3). Such membrane bound fluorescence was not observed with the p11-CT construct. (E) Western blot analysis of cytosolic and nuclear fractions of Cx55.5-FLAG, FL-FLAG and p11-CT-FLAG transfected N2A cells. 20 μg of total nuclear and 10 μg of cytosolic protein was separated by SDS-PAGE on a 12% gel. Immunoblot detection was done using anti-Cx55.5 as primary antibody (1 μg/ml). The upper lanes represent the full length Cx55.5 protein products expressed by the Cx55.5 wildtype protein and the FL mutant. The middle lane refers to the p11-CT protein expressed by the Cx55.5 wildtype and p11-CT proteins, but not by the FL mutation. The lower blot depicts the β-actin control. Note that the β-actin signal in the nuclear fraction is significantly reduced despite the fact that more protein was loaded on the gel. This indicates a minimal contamination with cytoplasmic remnants. |