
Fig. 6
- ID
- ZDB-FIG-080529-43
- Publication
- Preger et al., 2004 - Alternative splicing generates an isoform of the human Sef gene with altered subcellular localization and specificity
- Other Figures
- All Figure Page
- Back to All Figure Page
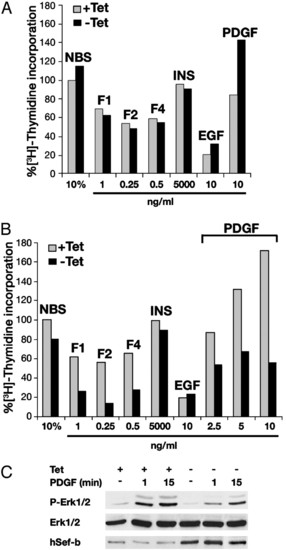
The spectrum of inhibitory activity of hSef-b. Mitogenic assay in control cultures (A) or cells expressing hSef-b (B) was performed as described in the legend to Fig. 3. Fold increase (FI) in biological activity was calculated by dividing cpm values obtained in the presence of the indicated stimulators with those obtained in 0.2% serum alone. Percent [3H]thymidine incorporation is relative to FI obtained in cultures stimulated with 10% serum in the presence of tet that was set at 100%. The concentrations of FGFs, insulin, epidermal growth factor, and serum are those that gave rise to a maximal biological response. F, FGF; INS, insulin. (C) hSef-b inducible NIH 3T3 cells were serum starved for 24 h in the presence and absence of tet and then stimulated with PDGF (20 ng/ml) for the indicated time periods. Equal amounts of total cell lysates were analyzed by immunoblotting with anti-P-ERK1/2 and anti-ERK antibodies. These experiments were repeated at least three times and by using two independent hSef-b-expressing clones. |