
Fig. 1
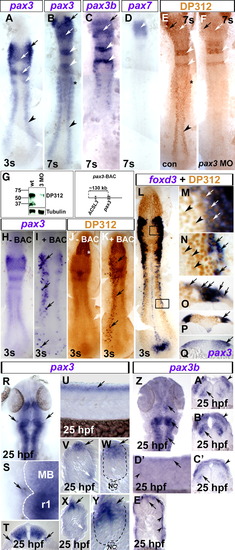
Pax3/7 expression in neural crest. In situ hybridisation for pax3 (A, B, H, I, Q–Y), pax3b (C, Z–E′), pax7 (D), foxd3 (L–P) and immunodetection of Pax3/7 by DP312 (E, F, J–P brown). Dorsal flat mounts (A–F, H–N, R, S, Z) have anterior to top. Lateral flat mount (U, D′) have dorsal up and anterior to left. Transverse cryosections (O–Q, T, V–Y, A′–C′, E′) have dorsal up. (A) At 3 s, pax3 is expressed in delaminated cranial NC (black arrow), lateral neural plate (black arrowhead) and the dorsal CNS, corresponding to posterior diencephalon/midbrain and rhombomeres 2/4 (white arrows; Seo et al., 1998). (B–D) At 7 s, pax3 mRNA is still detected in cranial NC (black arrows), neural plate (black arrowhead), rhombomeres (white arrowheads), dorsal brain regions (white arrows) and somites (black asterisk). Pax3b and pax3 mRNAs coincide in cranial NC (black arrow), rhombomeres 2/4 (white arrows) and dorsal brain (white arrows), but not in trunk NC. Pax7 mRNA is only expressed in the midbrain at 7 s (D, white arrow). (E, F) Pax3/7 immunoreactivity (DP312) corresponds to regions of pax3, pax3b and pax7 expression in wild type (E, compare to panels B–D). Pax3 MO injection ablated DP312 immunoreaction where pax3 mRNA does not overlap with expression of other pax3/7 genes (F, compare to black arrowhead in panel B), and reduced immunoreaction in cranial regions (arrows) and rhombomeres 2/4 (white arrowheads). (G) Western blot showing reduction in DP312 immunoreactivity in pax3 MO-injected embryos at 24 hpf, whereas tubulin loading control is unaltered. Zebrafish Pax3 and Pax7 have predicted Mr 55.7 kDa, Pax3b 53.3 kDa and Pax7b 56.3 kDa. The band at 37 kDa could represent alternate pax3/7 isoforms or degradation products. Note that the control lane is reprinted from Hammond et al. (2007). (H–K) Injection of a BAC containing pax3 (pax3-BAC, map above right) to wild type embryos results in mosaic over-expression of pax3 mRNA (I, black arrows) and protein (K, black arrows) in endogenous pax3 locations, demonstrating that DP312 recognises zebrafish Pax3. Note the lack of extra immunoreactivity in eye fields, in which DP312 reacts with Rx proteins (white asterisk; [Davis et al., 2005] and [Pujic and Malicki, 2001]). (L–Q) Foxd3 mRNA, a NC marker, co-localises around nuclear DP312 immunoreactivity (L–P). High magnification images of DP312 from black boxes in panel L in cranial NC cells (M, white arrows) and also neural crest precursors in the trunk lateral neural plate (N, black arrows). Pax3/7+ cells lacking foxd3 mRNA are also present in dorsal neural plate in cranial and trunk regions (M, N, respectively; black arrowheads). Transverse cryosections reveal that foxd3 mRNA (O, P, arrows) is located in the lateralmost region of highest pax3 mRNA (Q, arrow) accumulation in the neural plate, and in underlying delaminated NC cells. (R–T) Expression of pax3 outside the neural tube in putative ophthalmic lobe of trigeminal ganglion at 25 hpf (R–T; black arrows; white dashed line shows CNS boundary in panel S; MB midbrian, r1 rhombomere 1). (U–Y) In trunk (V, W) and tail (X, Y) regions, pax3 is expressed in the dorsal neural tube (black arrows) and lateral somite (white arrows). Note the lack of strong punctate pax3 expression in migrating NC cells. Black dashed lines show neural tube boundary. NC = notochord. (Z–E′) Pax3b mRNA is detected in dorsal neural tissue in head (Z–C′: arrows, neural laminae; arrowheads, NC) and trunk (D′, E′: arrows, neural tube; arrowheads, superficial somite region). |
| Genes: | |
|---|---|
| Fish: | |
| Anatomical Terms: | |
| Stage Range: | 1-4 somites to Prim-5 |
Reprinted from Developmental Biology, 317(2), Minchin, J.E., and Hughes, S.M., Sequential actions of Pax3 and Pax7 drive xanthophore development in zebrafish neural crest, 508-522, Copyright (2008) with permission from Elsevier. Full text @ Dev. Biol.