|
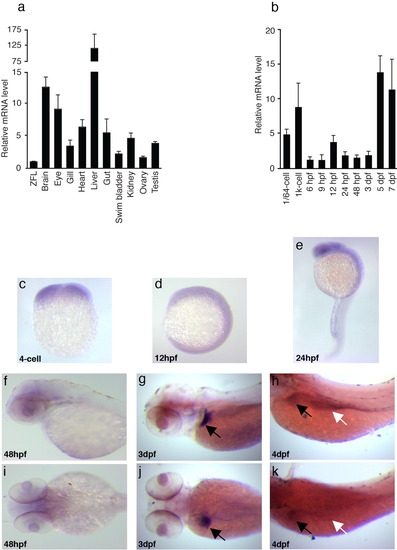
Tissue distribution and developmental expression pattern of lxr mRNA in zebrafish. a: RNA samples from adult zebrafish tissues were analyzed by qPCR. lxr expression was normalized to β-actin with the level of expression in ZFL cells set to 1. Values are the mean + SEM of three independent pools of organs from 5-10 adult zebrafish. b: Temporal pattern of lxr mRNA expression was analyzed by qPCR in 1/64-cell to 7-dpf embryos. The level of expression was normalized to β-actin and values are the mean + SEM of three independent pools of embryos. c-k: Spatial expression pattern of lxr was visualized by whole mount in situ hybridization. Lateral view: dorsal up and anterior to the left (c-h). Dorsal view (i-k). Black arrows indicate the liver (g,h,j,k) and white arrows indicate the intestine (h,k).
|