
Fig. 7
- ID
- ZDB-FIG-080411-15
- Publication
- Chen et al., 2008 - Liver-specific expression of p53-negative regulator mdm2 leads to growth retardation and fragile liver in zebrafish
- Other Figures
- All Figure Page
- Back to All Figure Page
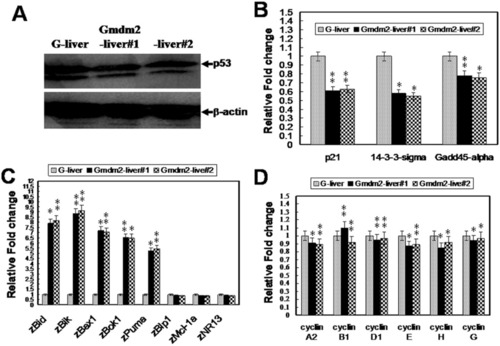
Detection of p53 protein and gene expression changes associated with altered cell death and growth in the degenerated liver of Gmdm2-liver lines. A: Expression of zebrafish p53 in the liver of G-liver, Gmdm2-liver#1, and Gmdm2-liver#2 using a p53 polyclonal antibody (Santa Cruz Biotechnology). B: Quantification of p53 regulatory genes of p21, 14-3-3-σ, and Gadd45-α were slightly down-regulated in the liver of Gmdm2-liver#1 and Gmdm2-liver#2 fish compared with G-liver by quantitative PCR. Expression analyses of the p53 regulatory genes using cDNA prepared from G-liver (n = 4-6) and Gmdm2-liver#1 (n = 4-7) and Gmdm2-liver#2 (n = 4-8). Data represent mean values ± SEM. Values were normalized against β-actin as a housekeeping gene, and represent relative fold change of mRNA expression to G-liver. The asterisks represent a statistically significant difference when compared with the G-liver: *P < 0.05 and **P < 0.01 levels. C: Quantification of cell apoptotic genes of zBid, zBik, zBax1, zBok1, and zPuma were highly up-regulated and the cell survival (anti-apoptotic) related-genes of zBlp1, zMcl-1a, and zNR13were slightly down-regulated in the liver of Gmdm2-liver#1 and Gmdm2-liver#2 fish compared with G-liver by quantitative PCR. Expression analyses of the apoptotic genes using cDNA prepared from G-liver (n = 4-8), Gmdm2-liver#1 (n = 4-6). and Gmdm2-liver#2 (n = 4-7). Data represent mean values ± SEM. Values were normalized against β-actin as a housekeeping gene, and represent relative fold change of mRNA expression to G-liver. The asterisks represent a statistically significant difference when compared with the G-liver: *P < 0.05 and **P < 0.01 levels. D: Quantification of cell cycle-related genes of cyclin A2, B1, D1, E, H, and G1 where there was no significant difference in the liver of Gmdm2-liver#1 and Gmdm2-liver#2 fish compared with G-liver by quantitative PCR. The β-actin primer was used as an internal control for real time PCR reaction. Relative fold-changes were determined by calculating the ratio of the mean expression values from the G-liver and Gmdm2-liver lines. PCR reactions were carried out in triplicate. Expression analyses of the cell cycle-related genes using cDNA prepared from G-liver (n = 4-6), Gmdm2-liver#1 (n = 4-8), and Gmdm2-liver#2 (n = 4-8). Data represent mean values ± SEM. Values were normalized against β-actin as a housekeeping gene, and represent relative fold change of mRNA expression to G-liver. The asterisk represents a statistically significant difference when compared with the G-liver: *P < 0.05 and **P < 0.01 levels. |