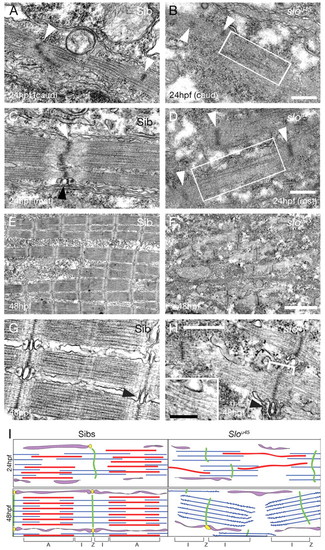
Sarcomeres in slou45 mutant myofibrils lack thick filaments. (A-H) Electron micrographs of sarcomeres from wild-type (Sib) (A,C,E,G) and slou45 mutant (B,D,F,H) myofibrils at the ages shown bottom left. (A,B) Caudal myotomes of 24 hpf zebrafish embryos. White arrowheads (A) show immature Z-discs with poorly positioned thick and thin filaments. In slou45 mutants, bundles of thin filaments are present with putative early Z-discs (B, arrowheads). Very rarely, structures of dimensions approximating to those of thick filaments were present (box, B). (C,D) Rostral myotomes of 24 hpf embryos. The wild type has recognisable sarcomeres with almost straight Z-discs (white arrowhead, C) and more fully formed sarcoplasmic reticulum with triads (black arrowhead, C). In the slou45 mutant, I-Z-I brushes are formed [Z-discs (white arrowheads, D) flanked on either side by thin filaments], and a few putative thick filaments are evident (box, D). (E-H) At 48 hpf, wild-type muscle fibres are packed with mature myofibrils (E,G), possessing mature triads at each Z-disc (black arrowhead, G). Mutant muscle fibres contain no thick filaments but numerous I-Z-I brushes are evident (F,H). The Z-lines are surrounded by an electron-dense region (bracket, H; F); beyond this region the thin filaments have light striations on them (see inset, H). Triads are present, although less common (black arrowhead, H). (I) Schematic summarising the principal differences between slou45 mutant and sibling sarcomere ultrastructure. At early stages of myofibrillogenesis (top), mutants have less numerous and malformed thick filaments (red), and I-Z-I brushes (green and blue) are present but less well aligned than siblings. By 48 hpf, wild-type sarcomeres are fully formed, whereas in mutants only misaligned and mis-spaced I-Z-I brushes with striated thin filaments are present (blue). T-tubules and sarcoplasmic reticulum are shown in yellow and purple, respectively. Scale bars: 500 nm in A-D,G,H; 2 μm in E,F; 100 nm in H inset.
|
