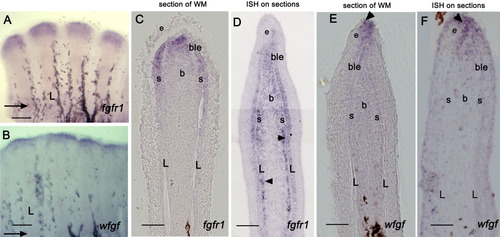
Comparison of the expression of fgfr1 and wfgf genes in 4-day fin regenerates using the two ISH methods. A, B: Whole-mount ISH showing expression of fgfr1 and wfgf in the distal region of the fin regenerate at 4 dpa. C: Upon sectioning of the whole-mount fins, fgfr1 expression is seen in the distal blastema, in the basal layer of the epidermis, and in a few cells of the newly differentiating scleroblasts. D: ISH on sections reveals a broader expression domain for fgfr1: transcripts are observed in the blastema midway through the proximal-distal axis. It is observed, not only in newly differentiating scleroblasts, but also in differentiated scleroblasts in more proximal regions lining the inner side of the lepidotrichia (arrowheads in D indicate scleroblasts). E: Sections of whole-mount fins hybridized with the wfgf probe shows that wfgf expression is confined to the epidermis in the most distal tip of the regenerate (arrowhead). F: wfgf expression following ISH on sections is similar to that seen following whole-mount ISH (arrowhead). Arrows in A and B indicate the level of amputation. L, lepidotrichia; b, blastema; ble, basal layer of epidermis; e, epidermis; s, scleroblasts. Scale bars = 100 μm (A,B), 50 μm (C-F).
|
