
FIGURE
Fig. 4
- ID
- ZDB-FIG-070918-38
- Publication
- Pugacheva et al., 2006 - Cloning and characterization of zebrafish CTCF: Developmental expression patterns, regulation of the promoter region, and evolutionary aspects of gene organization
- Other Figures
- All Figure Page
- Back to All Figure Page
Fig. 4
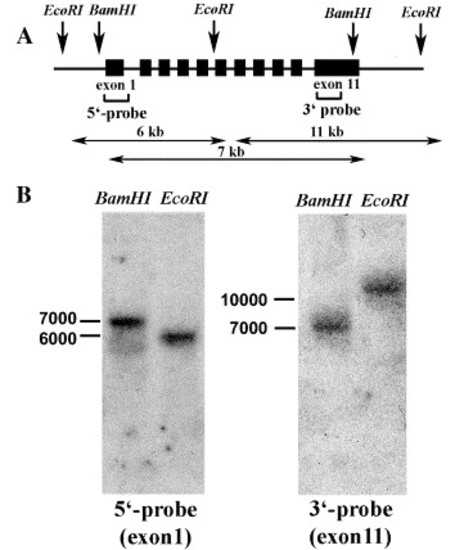
Southern blot analysis of the CTCF gene in zebrafish genomic DNA. (A) Schematic restriction map of the zebrafish CTCF gene showing enzymes used for Southern blot analysis, size of expected fragments and the respective probes. (B) Genomic DNA digested with EcoRI or BamHI restriction enzyme was electrophoresed and hybridized with labeled CTCF fragments representing exon1 and part of exon 11. Molecular weight markers are shown on the left of the panel. |
Expression Data
Expression Detail
Antibody Labeling
Phenotype Data
Phenotype Detail
Acknowledgments
This image is the copyrighted work of the attributed author or publisher, and
ZFIN has permission only to display this image to its users.
Additional permissions should be obtained from the applicable author or publisher of the image.
Reprinted from Gene, 375, Pugacheva, E.M., Kwon, Y.W., Hukriede, N.A., Pack, S., Flanagan, P.T., Ahn, J.C., Park, J.A., Choi, K.S., Kim, K.W., Loukinov, D., Dawid, I.B., and Lobanenkov, V.V., Cloning and characterization of zebrafish CTCF: Developmental expression patterns, regulation of the promoter region, and evolutionary aspects of gene organization, 26-36, Copyright (2006) with permission from Elsevier. Full text @ Gene