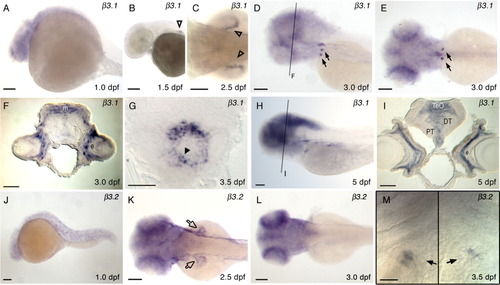
Expression of β3.1 (A-I), and β3.2 (J-M) in wild type zebrafish. Embryonic and larval stages: (A, J) 1 dpf; (B) 1.5 dpf; (C, K) 2.5 dpf; (D, E, F, L) 3.0 dpf; (G, M) 3.5 dpf; (H, I) 5 dpf. Marked expression fields are similar to Figure 3, except in K where β3.2 expression in pectoral fins is marked with open arrow. Transverse sections at the level of eye (F, I), and at the level of heart (G). F: β3.1 expression in 3.0 dpf zebrafish brain. m, medial tectal proliferation zone; e, eye. G: At 3.5 dpf β3.1 expression is present in the ventricle of embryonic heart tube (black arrowhead). I: β3.1 expression in 5.0 dpf zebrafish brain. DT, dorsal thalamus; e, eye; PT, posterior tuberculum; TeO, tectum opticum. Lateral views of embryos, anterior to the left, are shown in A, B, D, H, and J. Larva in D was slightly tilted to visualize bilateral expression in the deep posterior, ventral pharyngeal region. M: Two images of the same specimen, divided by a black line, at slightly different focal planes were taken to show β3.2 expression fields in the left and right halves of the deep posterior, ventral pharyngeal region: Ventral view of the specimen, anterior to the top, centered at the fifth ceratobranchial. Dorsal views of the embryos are shown in C, E, K, and L. Scale bars = 100 μm in A-E, H, J-L, 20 μm in F, G, I, and M.
|
