
Fig. 4
- ID
- ZDB-FIG-070810-6
- Publication
- Zhang et al., 2007 - SCL-GFP transgenic zebrafish: In vivo imaging of blood and endothelial development and identification of the initial site of definitive hematopoiesis
- Other Figures
- All Figure Page
- Back to All Figure Page
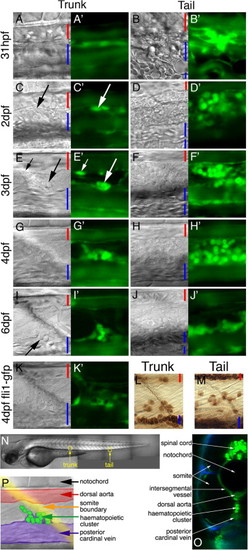
The development of hematopoietic clusters during late embryogenesis. Panels A–J show paired lateral views (left panel DIC, right panel GFP fluorescence) in scl-PAC-GFP transgenic embryos. Panels A, C, E, G and I show mid-trunk, and B, D, F, H and J show the ventral tail. Panel K shows paired views of the mid-trunk of a 4 dpf fli1-promoter-GFP transgenic embryo. Panel L and M show DAF staining for globin expression in the trunk and tail, respectively, of a 4 dpf embryo. Red bars indicate the dorso-ventral positions and sizes of the lumens of the major artery (DA in trunk, CA in tail). Blue bars indicate the lumens of the major vein(s) (PCV in trunk, CV in tail). All images are centred on boundaries between somites in the adjacent paraxial mesoderm. (A) Soon after the primitive erythroid cells of the ICM have entered circulation (31 hpf), the floor of the DA and roof of the PCV are closely apposed, and consist of thickened endothelia. These endothelia express GFP (A′) as do the circulating erythroid cells (blurred fluorescence in the lumens of the vessels). (B) The ventral tail region contains the CA and the anastomosing vessels comprising the CV. GFP (B′) is expressed in these endothelia and in clusters of round cells interspersed among the venous network. (C) 2 dpf: the endothelia of the floor of the DA and roof of the PCV have thinned and occasional cells with a rounder morphology are visible between the endothelia. These express GFP (C′). (D) Multiple round cells expressing GFP (D′) are present between the CA and CV. (E) 3 dpf: the DA and PCV have separated. Occasional round GFP-expressing cells adhere to the ventral surface of the DA (small arrows), but the majority of such cells have started to form small clusters on the roof of the PCV (large arrows). These clusters are adjacent to the boundaries between somites. (F) GFP-expressing round cells occupy much of the tissue between the CA and PCV. (G) 4 dpf: the GFP-expressing clusters have expanded in size (typically 5–25 cells), and the ventral-most cells are in contact with the lumen of the PCV (see also panel I). (H) More of the GFP-expressing round cells are present ventrally (near the CV) than dorsally (near the CA). (I) 6 dpf: the trunk clusters have begun to reduce in size. Ventral cells project into the lumen of the PCV and are presumably entering circulation. Small cluster are seen as late as 11 dpf (data not shown). (J) The hematopoietic cells in the tail are all associated with the roof of the CV. This expression is also maintained through later embryonic development. (K) Expression of GFP under control of an endothelium-specific fli1 promoter labels cells surrounding the trunk clusters, but not the cells in the clusters themselves. This GFP-expressing endothelium appears continuous with that of the PCV. Note, this does not imply that the clusters do not express endogenous fli1, only that the endothelial-specific promoter contained in the fli1-GFP construct is not active in these cells. (L) 4 dpf, trunk: a subset of cells in the trunk clusters expresses globin, as visualized by DAF staining. Staining can also be seen in circulating erythrocytes, both in the DA (dorsally) and PCV (ventrally). (M) Similarly, some of the cells between the CA and CV also express globin. (N) Lateral view of a 3 dpf embryo (bright field). The size and positions of the micrographs labeled ‘trunk’ and ‘tail’ in this image and in Fig. 5 and Fig. 6 are indicated. (O) ‘Virtual transverse section’ through the trunk of a living scl-PAC-GFP transgenic embryo, reconstructed from a confocal stack. GFP fluorescence in green, autofluorescence (predominantly pigment cells on the embryo surface) in blue. The hematopoietic clusters are in the midline of the embryo, between the paired hypaxial somites. (P) Schematic to aid interpretation of the DIC and fluorescence images in this image and in Fig. 6 and Fig. 7. A DIC image of the trunk region of a 4 dpf embryo has been false-colored to indicate the most important features: hematopoietic cluster—green; dorsal aorta—red; PCV—purple; somite boundary—yellow. At this stage of development, the cluster lies adjacent to the somite boundary, and in contact with the roof of the PCV. There is an out-pocketing of the PCV at the site of the cluster. |
Reprinted from Developmental Biology, 307(2), Zhang, X.Y., and Rodaway, A.R., SCL-GFP transgenic zebrafish: In vivo imaging of blood and endothelial development and identification of the initial site of definitive hematopoiesis, 179-194, Copyright (2007) with permission from Elsevier. Full text @ Dev. Biol.