
Fig. 5
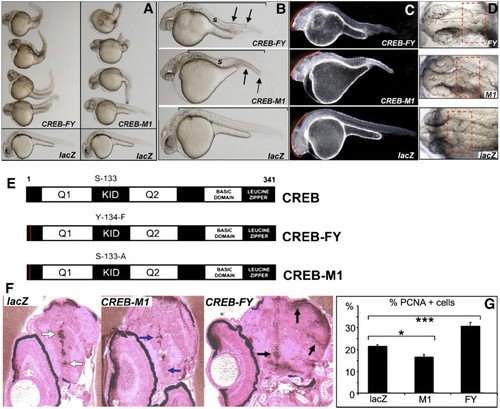
Zebrafish embryonic development is altered following perturbation of CREB activity. Single cell embryos injected with 75–125 pg synthetic, capped mRNA encoding full-length constitutively active CREB-FY or dominant negative CREB-M1 show severe developmental defects, compared with control lacZ RNA-injected embryos (A). Embryos injected with CREB-FY or CREB-M1 mRNAs (B) show curvature of anterior–posterior axis, (black arrows) decreased axis length from otic vesicle to tail (bar), severe disruption of neural patterning, microcephaly and eye development (**) and somite shape and spacing (s). Darkfield imaging (C) highlights specific neural structural disorganization (band) in both CREB-FY and CREB-M1 injected fish, compared with lacZ control. Dorsal views of CREB-FY and CREB-M1 injected fish (D) show specific disruption of the midbrain/hindbrain boundary (MHB; boxes) relative to control. (E) The structure of the CREB constructs used for injections, showing the N-terminal glutamine-rich transactivation domains (Q1 and Q2) surrounding the kinase-inducible domain (KID) harboring the serine-133 residue mutated to alanine in CREB-M1; CREB-FY has the tyrosine-134 residue mutated to phenylalanine. The C-terminal basic-domain has the DNA-binding interface and the leucine-zipper region has the dimerization interface. (F) Immunodetection of the marker of proliferation, PCNA in the midbrains of 24 hpf injected embryos shows an increased abundance and distribution of PCNA positive cells in the brains of CREB-FY injected embryos (black arrows) when compared to LacZ controls, which display an ordered, regular pattern of PCNA expression (white arrows), lining the walls of the diencephalic ventricles. CREB-M1 injected embryos display a decrease in the number of PCNA positive cells, although the WT pattern of expression is retained (blue arrows). Automated morphometric quantitation (METAMORPH) analysis (G) shows a significant difference between the number of PCNA positive cells in the embryonic midbrain of CREB-FY and CREB-M1 injected embryos relative to controls (n = 10 for CREB-FY and CREB-M1, n = 8 for lacZ control; *p < 0.05, ***p < 0.001 using the unpaired t-test). |
Reprinted from Developmental Biology, 307(1), Dworkin, S., Heath, J.K., Dejong-Curtain, T.A., Hogan, B.M., Lieschke, G.J., Malaterre, J., Ramsay, R.G., and Mantamadiotis, T., CREB activity modulates neural cell proliferation, midbrain-hindbrain organization and patterning in zebrafish, 127-141, Copyright (2007) with permission from Elsevier. Full text @ Dev. Biol.