|
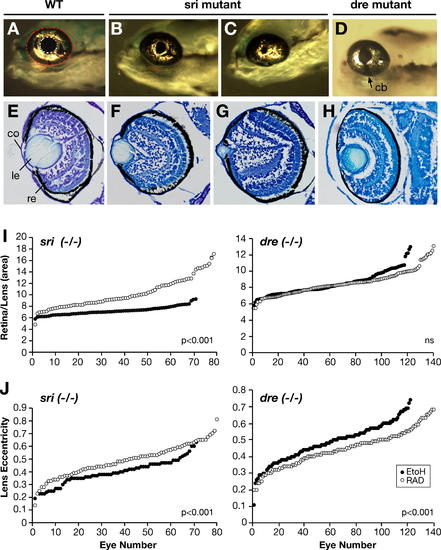
Assessing Range of Expressivity and Quantifying Phenotype Modulation in sri and dre Strains (A–H) Phenotype of the sri and dre eye mutants at 5 dpf. (A–D) Lateral view of live embryos; (E–H) histological sections. (A) WT; lens (white-dotted lines) and retina (red-dotted lines) measurements were used to asses phenotypic severity; (E) WT section showing retina (re), lens (le), cornea (co); (B) and (F) sri mild and (C) and (G) sri severe; (D) dre with coloboma (cb); (H) dre showing flattened anterior segment. (I and J) Ranked plots showing distribution of quantitative eye parameters in treated (white circles) and sibling control (black circles) homozygous embryos: (I) Ratio of retina to lens area; (J) Lens shape or eccentricity.
|