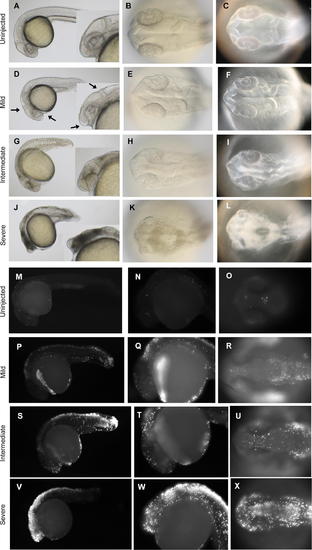
Representative Cell Death Phenotypes Detected at 26 hpf. Brightfield (A, B, D, E, G, H, J, and K) and darkfield images (C, F, I, and L) of 26 hpf zebrafish embryos injected with Wnt5 MO1. (M–X) TUNEL assay. Lateral views (A, D, G, J, M, N, P, Q, S, T, V, and W), with inserts showing a higher magnification of the head region (A, D, G, and J). Dorsal view of the head (B, C, E, F, H, I, K, L, O, R, U, and X). The two classes of phenotypes described in Figure 3 are observed at this time point, too (intermediate, G–I and P–R; severe, J–L and S–T; uninjected embryos, A–C and M–O). At 26 hpf, however, a milder cell death phenotype was also observed (D–F). This class of embryos exhibited an anterior-ventral concavity and a depressed hindbrain (indicated by the arrows), without tissue with obvious characteristic cell-death patterns featured by embryos with intermediate and severe phenotypes (compare [F] to [I] and [L]). However, even these mildly affected embryos showed clear apoptosis indicated by the TUNEL assay (P–R).
|
