
Fig. 5
- ID
- ZDB-FIG-070613-80
- Publication
- Skromne et al., 2007 - Repression of the hindbrain developmental program by Cdx factors is required for the specification of the vertebrate spinal cord
- Other Figures
- All Figure Page
- Back to All Figure Page
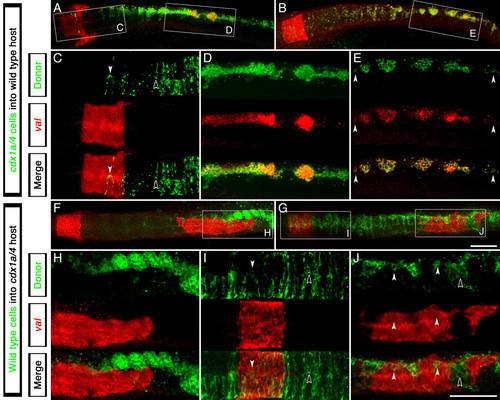
Autonomous requirement of Cdx factors in the zebrafish CNS for hindbrain and spinal cord specification. Expression analysis of the r5/6 marker val (red staining) in clones of cdx1a/cdx4-deficient cells transplanted into wild-type hosts (A-E) or wild-type cells transplanted into cdx1a/cdx4-deficient host embryos (F-J) (transplanted cells in green). (A,B) cdx1a/cdx4-deficient cells can incorporate into the wild-type host CNS at all axial levels. The boxed regions are shown at higher magnification in C-E. (C) cdx1a/cdx4-deficient cells are evenly distributed in hindbrain and spinal cord regions of the CNS, only expressing val when located in the r5/6 territory (white arrowhead compared with black arrowhead). (D,E) cdx1a/cdx4-deficient cells located in the caudal spinal cord tend to form clusters of cells that express val (n=8). Surrounding wild-type cells do not express this marker. Isolated cells also express this gene (arrowheads). (F,H) cdx1a/cdx4-deficient embryos show ectopic val expression in the posterior CNS despite the presence of wild-type cells in the paraxial mesoderm (n=2). (G) Incorporation of wild-type cells throughout the CNS of cdx1a/cdx4-deficient hosts. The boxed regions are shown at higher magnification in I and J. (I) Uniform distribution of wild-type cells in the hindbrain and surrounding regions of cdx1a/cdx4-deficient host embryos. Cells located within the r5/6 region express the marker val (white arrowheads compared with black arrowheads). (J) In the posterior CNS, most wild-type cells segregate in clusters that fail to express val (black arrowhead). When in isolation, wild-type cells express val (white arrowheads, n=5). Confocal 3 µm sections of dorsal flat-mounted embryos, anterior to the left. Scale bars: in G, 100 µm for A,B,F,G; in J, 100 µm for C-E,H-J. |