
Fig. 6
- ID
- ZDB-FIG-070613-29
- Publication
- Ribeiro et al., 2007 - Tbx2 and Tbx3 Regulate the Dynamics of Cell Proliferation during Heart Remodeling
- Other Figures
- All Figure Page
- Back to All Figure Page
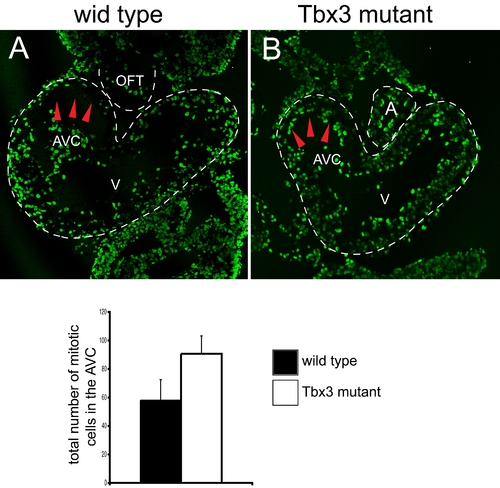
Immunohistochemical analysis of cell proliferation in E9.5 wild type (A) and Tbx3 mutant (B) hearts using antibodies against BrdU (A, B) or phospho-Histone 3 (C). (A, B) Representative sections at the level of the AVC of wild type and mutant hearts are shown. The heart is outlined by a discontinuous white line. The density of BrdU positive cells is higher in the AVC of mutant hearts than in the AVC of wild type hearts (red arrowheads). (C) The number of phospho-Histone3-positive cells in the AVC was counted in consecutive heart sections at the level of the AVC of four wild type embryos with 30–31 somites and three mutant embryos with 30–32 somites. The average number of mitotic cells for the AVC is represented in a histogram. The number of mitotic cells in the AVC is significantly increased (P<0.010) in mutant embryos (90.7±12.7), compared to wild type embryos (58.3±14.5). A, atrium; AVC, atrioventricular canal; OFT, outflow tract; V, ventricle. |