
Fig. 4
- ID
- ZDB-FIG-070613-27
- Publication
- Ribeiro et al., 2007 - Tbx2 and Tbx3 Regulate the Dynamics of Cell Proliferation during Heart Remodeling
- Other Figures
- All Figure Page
- Back to All Figure Page
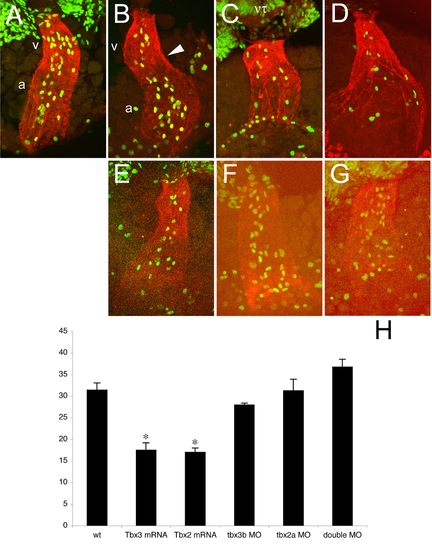
All images represent reconstructions of confocal Z-stack sections imaged on whole embryos at 31hpf (A) and 33 hpf (B–G). (A, B) During the first steps of looping, the pattern of proliferation shifts from homogenous throughout the heart tube (31 hpf, A) to a heterogenous one in which dividing cells are more concentrated in the future chambers (33 hpf, B). (C, D) In Tbx3- (C) and Tbx2- (D) injected embryos at 33 hpf this shift has not occurred and the number of dividing cells was significantly decreased and dividing cells were homogenously distributed (H). (E–G) MO-injected embryos against tbx3b (E), tbx2a (F) or both (G) display the same (E, F) or higher (G) number of proliferating cells than wild type at 33 hpf. However, proliferating cells remain homogenously distributed throughout the heart tube. (H) Histogram showing the average of the total number of BrdU positive cells in the heart of 33 hpf embryos: wt, 31.4±1.661 (n = 5); Tbx3 mRNA, 17.5±1.708 (p<0.001; n = 6); Tbx2 mRNA, 17.0±1.000 (p<0.001; n = 7); tbx3b MO, 28.0±0.408 (n = 4); tbx2a MO, 31.3±2.658 (n = 4); double MO, 36.8±1.797 (n = 4). a, atrium; h, heart; nt, neural tube; v, ventricle. |