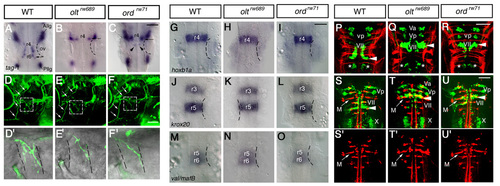
olt and ord genes do not affect overall brain patterning. (A-C) tag-1 mRNA expression in the wild-type (A), oltrw689 (B) and ordrw71 (C) embryos at 24 hpf. Although the nVII motor neurons showed abnormal behavior and ectopic localization in the olt and ord embryos, they expressed tag-1 mRNA, a marker for nVII motor neurons. All or most of the tag-1-positive cells were located in r4 in the olt and ord embryos (arrows in B and C). Some of the tag-1-positive cells were located in r5 in the ord embryos (arrowheads in C). (D-F) Isl1-GFP expression in the wild-type (D), olt (E) and ord (F) embryos at 5 days post-fertilization. The trajectories of facial motor axons were normal in the mutant embryos (arrows) and the axons reached the target muscles. (D′,E′,F′) Higher magnifications of the boxed regions in D-F. (G-O) Expression pattern of the rhombomere-specific genes in the wild-type (G,J,M), olt (H,K,N) and ord (I,L,O) embryos at 20 hpf. Expression patterns of hoxb1a (G-I), krox20 (J-L) and val/mafB (M-O) mRNA were unaffected in the mutant embryos. (P-R) Commissural axons labeled with zn-5 antibody (red) in the wild-type (P), olt (Q) and ord (R) Isl1-GFP embryos at 36 hpf. (S-U) Reticulospinal neurons retrogradely labeled (red) in the wild-type (S), olt (T) and ord (U) Isl1-GFP embryos at 5 hpf. (S′,T′,U′) Single-channel images for the labeled neurons. Dorsal views of the embryos are shown; the anterior of the embryo is at the top of the figure. Va, anterior trigeminal nuclei; Vp, posterior trigeminal nuclei; VII, facial nucleus; X, vagus nucleus; Allg, anterior lateral line ganglion; Pllg, posterior lateral line ganglion; M, Mauthner′s cell. Asterisks indicate the r6-derived putative octavolateralis efferent (OLe) neurons (Wada et al., 2005). Otic vesicles (ov) are indicated by broken lines. Scale bars: 50 μm.
|
