
FIGURE
Fig. 5
- ID
- ZDB-FIG-061122-29
- Publication
- Liebling et al., 2006 - Rapid three-dimensional imaging and analysis of the beating embryonic heart reveals functional changes during development
- Other Figures
- All Figure Page
- Back to All Figure Page
Fig. 5
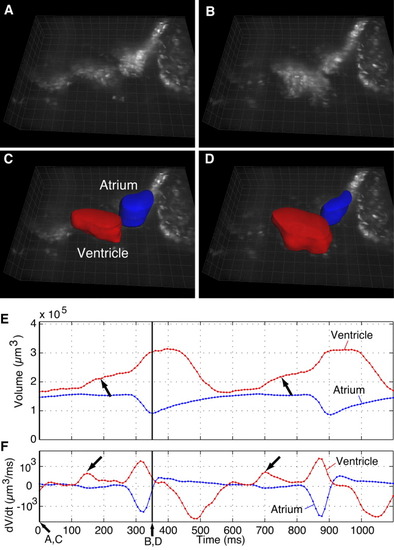
A-D: Three-dimensional renderings of 148 hours postfertilization (hpf) Tg (gata1:GFP) zebrafish heart at systole (A,C) and diastole (B,D). C,D: The atrium (blue) and the ventricle (red) have been segmented. E: Volume change over two cycles. F: Derivative of volume with respect to time over two cycles. Two phases of ventricle filling precede blood ejection from the ventricle. The first phase occurs before atrial ejection, and the second is coincident with atrial ejection. Arrows indicate passive filling of the ventricle. GFP, green fluorescent protein. Grid spacing = 20 μm. |
Expression Data
Expression Detail
Antibody Labeling
Phenotype Data
Phenotype Detail
Acknowledgments
This image is the copyrighted work of the attributed author or publisher, and
ZFIN has permission only to display this image to its users.
Additional permissions should be obtained from the applicable author or publisher of the image.
Full text @ Dev. Dyn.