
Fig. 7
- ID
- ZDB-FIG-060410-7
- Publication
- Jadrich et al., 2006 - The TGFβ activated kinase TAK1 regulates vascular development in vivo
- Other Figures
- All Figure Page
- Back to All Figure Page
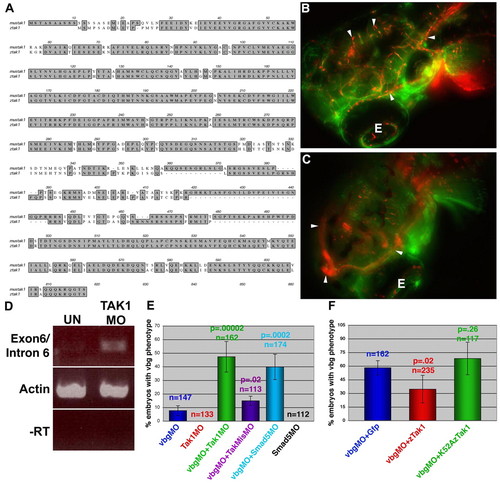
Overexpression of TAK1 rescues knockdown of ALK1 in zebrafish vascular development. (A) The alignment of zebrafish TAK1 and mouse TAK1 proteins. (B) Wild-type cranial circulation in zebrafish containing the Gata1:DsRed and Fli:GFP reporter transgenes. Red, the circulating blood cells; green, the endothelium of the vasculature. Arrowheads indicate the complex meshwork of cranial circulation. E, eye. (C) Cranial circulation in vbg morpholino-injected fish. Arrowheads indicate the large dilated vessels that shunt blood away from the complex meshwork of vessels resulting in a dilated loop of circulation. (D) rtPCR analysis to detect inclusion of intron 6 in tak1 transcripts upon tak1 morpholino injection. A forward primer in exon 6 and a reverse primer in intron 6 detect an increase in inclusion of intron 6 in tak1 transcripts in tak1 morpholino-injected embryos (TakMO) in comparison with uninjected embryos (UN). Primers to actin were used as a control for the amount of cDNA in each reaction, and samples lacking reverse transcriptase (-RT) were used as a negative control. (E) The average percentage of fish displaying the dilated cranial vasculature after injection with vbg morpholino, tak1 morpholino (or both), vbg morpholino with Smad5 morpholino or Smad5 morpholino alone. Each bar represents the average of four or five sets of injections. (F) Summary of the average percentage of injected fish displaying the vbg morpholino phenotype shown in C after injection with morpholino plus Gfp, tak1 or L52AzTak1 mRNA. Each bar represents the average percent of embryos over 6 sets of injections. Although tak1 RNA injection led to rescue in each injection, the level of rescue varied from 11-62%, which is the cause of the large error bars. Error bars in E and F represent the confidence interval for each set. Total number of fish injected is indicated above each bar and the P-value for each condition in comparison with vbgMO (3 ng) alone (E) or with vbgMO+Gfp (F) is displayed above each bar. |