
- Title
-
The TGFβ activated kinase TAK1 regulates vascular development in vivo
- Authors
- Jadrich, J.L., O'connor, M.B., and Coucouvanis, E.
- Source
- Full text @ Development

Structure of the Tak1 genetrap allele and western analysis of TAK1 protein. (A) The genetrap insertion in the Tak1 locus. The insertion is between exon 1 (E1) and exon 2 (E2) of Tak1. The genetrap contains a splice acceptor (SA) upstream of the βgeo gene, which is linked via an internal ribosome entry site (I) to the placental alkaline phosphatase gene (PLAP). Genomic DNA was digested with HindIII (Hd3) for Southern blotting using a probe just outside the insertion site (red box). (B) Genotyping by Southern blot and transcript levels in Tak1{delta}/{delta} embryos. Southern blot of DNA extracted from yolk sacs of E9.5 embryos derived from Tak1+/{delta} intercrosses. The wild-type and genetrap alleles result in probe hybridization to 2.7 kb and 6.7 kb bands, respectively. (C) rtPCR analysis of wild-type transcript (primers amplifying exon1 to exon 2 of Tak1), fusion transcript (primers amplifying exon1 to βgeo) and actin as a control for the amount of cDNA that was amplified in each sample. Samples that did not contain reverse transcriptase (–RT) were used as a control for DNA contamination. A small amount of wild-type transcript is detected in Tak1{delta}/{delta} samples. (D) Western blot analysis of lysates from E10.5 embryos derived from Tak1+/{detla} intercrosses with a polyclonal antibody to full-length TAK1. A 70 kDa doublet is visible in Tak1+/+ and +/{delta} samples, but is missing in the Tak1{delta}/{delta} sample. The TAK1 antibody used also detects a GST background band (labeled GST) and a band of 150 kDa in Tak1+/{delta} and {delta}/{delta} samples, which is probably the predicted fusion protein between exon 1 of Tak1 and βgeo. The amount of total protein per lane was determined by assaying β-tubulin levels. |
|
Tak1{Delta}/{Delta} embryos are abnormal by E9.5. (A-C) E9.5 embryos. (D-F) E10.5 embryos. (A,D) Tak1+/{Delta} control embryos. (B,C,E,F) Tak1{Delta}/{Delta} embryos. The Class II Tak1{Delta}/{Delta} embryo at E9.5 (B) is slightly reduced in size. The Class I Tak1{Delta}/{Delta} embryo (C) is further reduced in size in comparison with the embryo in B, and has a pericardial edema (arrow). The less severely affected Tak1{Delta}/{Delta} embryo at E10.5 (E) is reduced in size and has a small head. The more severely affected Tak1{Delta}/{Delta} embryo at E10.5 (F) is severely reduced in size, and has localized areas of necrosis and a large pericardial edema (arrow). |
|
Tak1{Delta}/{Delta} embryonic heart phenotype. (A,C,E) Wild-type E9.5 embryos. (B,D,F) E9.5 Tak1{Delta}/{Delta} embryos. (A,B) Sagittal sections immunostained with an antibody to smooth muscle α actin, labeling the myocardium (brown). Arrowheads indicate trabeculation within each ventricle. Endocardial cushion formation takes place normally in both embryos (arrows) and the curved myocardium in both panels indicates that looping has taken place. (C,D) Embryos labeled with an antisense probe to Gata4. Gata4 labels the extension of the primary heart field and inflow tract at this stage (arrowhead). (E,F) Embryos labeled with an antisense probe to Anf, marking the atrium and ventricle. A, atrium; V, ventricle. |
|
The yolk sac vasculature of the Tak1{Delta}/{Delta} embryos fails to undergo angiogenesis. (A,B) E9.5 yolk sacs of Tak1+/{Delta} and Tak1{Delta}/{Delta} embryos, respectively. The yolk sac vascular plexus in A has undergone angiogenesis to create a branched network of mature vitelline vessels (arrowhead). The yolk sac vascular plexus in B has not remodeled but has retained its honeycomb-like structure of blood islands (arrowhead). The vessels in B are also prone to rupture, causing pooling of blood in the yolk sac (arrow). (C,D) Cross-sections of Tak1+/{Delta} and Tak1{Delta}/{Delta} yolk sacs, respectively, that are immunostained for vSMCs with an antibody to SMA (brown). The Tak1+/{Delta} yolk sac in C contains a mature vitelline vessel surrounded by a layer of smooth muscle (arrowhead). The Tak1{Delta}/{Delta} yolk sac in D has no mature vitelline vessels, the existing vessels are extremely dilated and have little SMA expression. |
|
The vascular architecture of Tak1{Delta}/{Delta} embryos is abnormal. In all panels, the developing vasculature of embryos was visualized by whole mount immunohistochemistry using an α-PECAM antibody. (A) Tak1+/{Delta} at E9.5. (B,C) Tak1{Delta}/{Delta} at E9.5. Two different vascular abnormalities are seen in Tak1{Delta}/{Delta} embryos. The embryo in B has an extremely dilated anterior dorsal aorta (arrowheads) in comparison with the Tak1+/{Delta} dorsal aorta in A (arrowheads). The embryo in C has a collapsed anterior dorsal aorta (arrowheads) and a dilated posterior dorsal aorta (arrow) in comparison with the posterior dorsal aorta in A (arrow). (D-F) Cranial sections of the heads shown in A-C, respectively. Arrowheads and broken lines indicate examples of cranial vessels that are extremely dilated in Tak1{Delta}/{Delta} embryos (E,F) in comparison with heterozygous embryos (D). (G-I) Cranial sections through the dorsal aorta of the embryos in A-C, respectively. Arrowheads indicate the dilated dorsal aorta in H and collapsed dorsal aorta in I in comparison with the heterozygote (arrowhead in G). (J) E10.5 Tak1+/{Delta} embryo exhibiting extensive remodeling of the vessels, most visibly in the head. (K) Tak1{Delta}/{Delta} embryo at E10.5, which has much less remodeling in comparison with the embryo in J (compare the tree-like branching vasculature of the head in J with the more honeycomb-like vasculature in K). The embryo in K also has a collapsed anterior (arrowhead) and posterior (arrow) dorsal aorta. |
|
Tak1{Delta}/{Delta} embryos have defects in vascular smooth muscle. To visualize smooth muscle, embryos were stained by immunohistochemistry using an antibody to SMA (purple staining in all panels). (A-C) E9.5 embryos. (D-F) E10.5 embryos. At E9.5 the Tak1+/{Delta} control embryo has a layer of SMA-expressing cells beginning along the dorsal aorta (A, arrowheads). The class II (B) and class I Tak1{Delta}/{Delta} (C) embryos have no SMA expression along their dorsal aorta (arrowheads). At E10.5, the Tak1+/{Delta} control embryo (D) shows a continuous layer of SMA expression all along the dorsal aorta (arrowheads). The more severely affected Tak1{Delta}/{Delta} embryo (F) has a complete absence of SMA expression in the dorsal aorta (arrowheads) and the less severely affected embryo (E) has only a few loosely associated expressing cells (arrowheads). All the embryos display staining of the somites and heart. S, somites; O, otic vesicle; H, heart. |
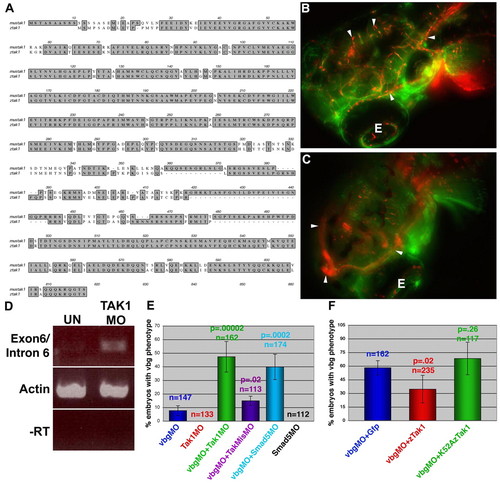
Overexpression of TAK1 rescues knockdown of ALK1 in zebrafish vascular development. (A) The alignment of zebrafish TAK1 and mouse TAK1 proteins. (B) Wild-type cranial circulation in zebrafish containing the Gata1:DsRed and Fli:GFP reporter transgenes. Red, the circulating blood cells; green, the endothelium of the vasculature. Arrowheads indicate the complex meshwork of cranial circulation. E, eye. (C) Cranial circulation in vbg morpholino-injected fish. Arrowheads indicate the large dilated vessels that shunt blood away from the complex meshwork of vessels resulting in a dilated loop of circulation. (D) rtPCR analysis to detect inclusion of intron 6 in tak1 transcripts upon tak1 morpholino injection. A forward primer in exon 6 and a reverse primer in intron 6 detect an increase in inclusion of intron 6 in tak1 transcripts in tak1 morpholino-injected embryos (TakMO) in comparison with uninjected embryos (UN). Primers to actin were used as a control for the amount of cDNA in each reaction, and samples lacking reverse transcriptase (-RT) were used as a negative control. (E) The average percentage of fish displaying the dilated cranial vasculature after injection with vbg morpholino, tak1 morpholino (or both), vbg morpholino with Smad5 morpholino or Smad5 morpholino alone. Each bar represents the average of four or five sets of injections. (F) Summary of the average percentage of injected fish displaying the vbg morpholino phenotype shown in C after injection with morpholino plus Gfp, tak1 or L52AzTak1 mRNA. Each bar represents the average percent of embryos over 6 sets of injections. Although tak1 RNA injection led to rescue in each injection, the level of rescue varied from 11-62%, which is the cause of the large error bars. Error bars in E and F represent the confidence interval for each set. Total number of fish injected is indicated above each bar and the P-value for each condition in comparison with vbgMO (3 ng) alone (E) or with vbgMO+Gfp (F) is displayed above each bar. |