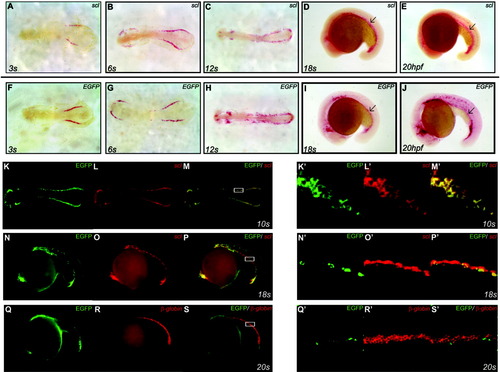
The enhanced green fluorescence protein (EGFP) transcript expression pattern in the Tg(5' 5kbscl:EGFP)a transgenic fish. A-J: Flat-mount (3s, 6s, and 12s) and lateral (18s and 22s) views of the 3-somite (3s), 6-somite (6s), 12-somite (12s), 18-somite (18s) somite, and 22 hours postfertilization (hpf) Tg(5' 5kbscl:EGFP)a embryos (anterior to the left) show the endogenous scl (A-E) and EGFP (F-J) transcripts in the anterior lateral mesoderm (ALM) and posterior lateral mesoderm (PLM) region. The EGFP transcript in the middle region of the PLM indicated by arrows is drastically reduced in 18s and 22 hpf embryos. K,L: Flat-mount views (original magnification, x10) of the 10s Tg(5' 5kbscl:EGFP)a embryos (anterior to the left) show colocalization of the EGFP transcript (green) and endogenous scl (red) mRNA. M: Superimposed view of K and L. K'-M': Confocal images (original magnification, x40) of the boxed region in K, L, and M show the EGFP transcript-positive (green) and endogenous scl transcript-positive (red) cells. N,O: Lateral views (original magnification, x10) of the 18s Tg(5' 5kbscl:EGFP)a embryos (anterior to the left) indicate that the EGFP transcript (green) and endogenous scl mRNA (red). P: Superimposed view of N and O. N'-P': Confocal images (original magnification, x25) of the boxed region in N, O, and P show partial colocalization of the EGFP transcript (green) with the endogenous scl mRNA (red). Q,R: Lateral views (original magnification, x10) of the 20s Tg(5' 5kbscl:EGFP)a embryos (anterior to the left) indicate that the EGFP transcript (green) and the endogenous embryonic βe1-globin mRNA (red). S: Superimposed view of Q and R. Q'-S': Confocal images (original magnification, x25) of the boxed region in Q, R, and S show that the EGFP transcript (green) is not overlapped with the endogenous embryonic βe1-globin mRNA (red).
|
