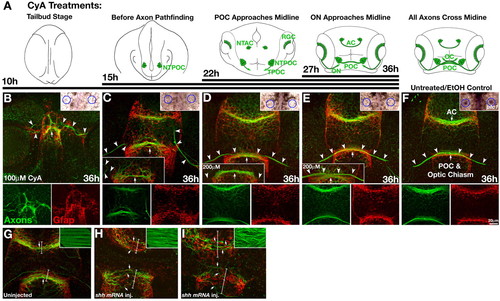
Timed inhibition of Hh signaling with cyclopamine. (A) Diagrams showing the position of forebrain axons (green) at the time cyclopamine (CyA) was applied and the duration of CyA treatment (black lines). (B-I) Frontal views of the forebrain double labeled for axons (anti-AT, green) and glial cells (anti-Gfap, red) at 36 hpf following treatment with 100 μM CyA starting at 10 hpf (B), 15 hpf (C), 22 hpf (D) and 27 hpf (E), and at 34 hpf in uninjected (G) and shh mRNA-injected (H-I) embryos. (F) EtOH (CyA carrier)-treated control embryo. (B-F) Bottom panels show separated red and green channels; upper insets show ptc1 gene expression in the fin buds (circled). (B) Treatment with 100 μM CyA from 10 hpf to 36 hpf resulted in major disruption of forebrain midline development, complete disorganization of forebrain axons (arrowheads) and glial cells, and complete loss of ptc1 expression in fin buds (circles, upper right inset). (C) Treatment with 100 μM CyA from 15 hpf to 36 hpf resulted in ipsilateral RGC projections (arrowheads), a reduced (n=13; C, lower inset) or defasciculated (n=16) POC (arrows), disorganized glial cells around the POC, and complete loss of ptc1 in fin buds (circles, upper right inset). (D,E) AC, POC (arrows) and RGC (arrowheads) axons cross the midline normally in embryos treated with CyA starting at 22 hpf and 27 hpf. CyA treatment (200 µM) gave the same results (lower insets). Again, the limb buds lacked ptc1 expression (circles, upper right insets). (F) Normal commissure, chiasm and glial bridge formation in EtOH-treated control embryos. Inset shows normal limb bud ptc1 expression (circles, upper right inset). (G-I) Analysis of axons and astroglial cells following shh mRNA injection. (G) Uninjected embryo. (H) Following low levels of Hh activation (approximate doubling of superficial slow muscle fibers; anti-F59, green, inset), the AC was dramatically reduced, the POC was highly defasciculated, RGC axons were absent (green, arrows), and glial bridges were expanded (red, brackets). (I) Following high levels of Hh activation (complete transfating of the entire somite into slow muscle fibers; inset), the AC was similarly reduced, the POC was severely reduced and exhibited wandering axons, RGC axons were absent (green, arrows), and expansion of the glial bridges was more pronounced (red, brackets). NTPOC, Nucleus of the tract of the POC; NTAC, nucleus of the tract of the AC; ON, optic nerve; OC, optic chiasm.
|
